
 Click here for the new Anchor Rising & Ocean State Current page

1,700,000+ "Sick" Brits Mysteriously Cured When Gov't Implemented Medical Testing For Incapacity Benefit, by Monique Chartier
Social Services
10:46 PM, 04/ 1/13
Things We Read Today, 1, by Justin Katz
Political Thought
7:10 PM, 09/ 3/12
The NASA Question, by Patrick Laverty
Social Services
9:00 PM, 08/ 6/12
How to Fix the RI Economy, by Patrick Laverty
Social Services
1:00 PM, 06/ 7/12
"Single, Ready to Mingle", by Patrick Laverty
Social Services
4:00 PM, 04/20/12
Explaining the Cuts to Services for Developmentally Disabled, by Marc Comtois
Social Services
1:00 PM, 02/19/12
Just How Widespread Is SNAP Abuse?, by Patrick Laverty
Social Services
10:45 PM, 12/23/11
Grotesque Claim: Reduction of Welfare Benefits A Violation of Due Process, by Monique Chartier
Social Services
12:00 PM, 10/ 1/11
The more things change..., by Marc Comtois
Social Services
10:00 AM, 05/17/11
What Our Welfare State Hath
Social Services
10:05 AM, 02/16/11
April 1, 2013

1,700,000+ "Sick" Brits Mysteriously Cured When Gov't Implemented Medical Testing For Incapacity Benefit
It's a MIRACLE!
... almost 900,000 have dropped their claim to the taxpayer-funded benefits rather than undergo a new medical test as part of the Coalition welfare reforms. ...Another 837,000 who did take the test were found to be fit to work immediately, and a further 367,300 were judged able to do some level of work.
Or possibly it's responsible stewardship of public dollars. (Definition of the United Kingdom's "incapacity benefit" here.)
Disability claims have risen steadily in the United States - even as work-related injuries have declined, by the way. (H'mmm.) This increase of s.s.d.i. claims has threatened the federal budget on both the spending and the revenue sides: by the outflow of claims payments and by the absence of the income tax that would be coming in if the recipient had gainful employment. Do you suppose if we implemented similar medical testing or, heaven forbid, tightened up the qualifying standard slightly - heck, just put it back the way it was in 1981 - we might work some "miracle" cures on our side of the pond?
September 3, 2012

Things We Read Today, 1
One thing I've learned, in years of blogging, is to be wary of proclaiming new regular features. Yet, I've been finding myself at the end of each day with a browserful of tabs of content on which I'm inclined to comment.
So, as interest and time allow, I'll publish quick-hit posts containing commentary that is somewhere between a tweet and a full-on blog post.
August 6, 2012

The NASA Question
Is something in the water over there on the Wampanoag Trail at the WPRO studios? I'm amazed at what I'm hearing. First, today Dan Yorke was going on about how great the Mars landing was for NASA and his opinion that this is the kind of thing that we should be spending tax dollars on. Skip ahead a couple hours to the Matt Allen Show and Matt has a similar opinion. He's all geeked out about the technology and how successful it all was and how he also seems to agree on using tax dollars to fund space exploration.
I couldn't disagree more.
First, I'll agree that it is an awesome achievement and I share Matt's "what ifs" with questions like what if NASA finds traces of DNA or some new element that is a cure for cancer. Those are great reasons to be there. I just feel we should not be using tax dollars to do it.
When my friends on the left tire of my whining about the federal budget, they'll ask something along the lines of "Ok smart guy, what would you cut?" expecting the usual "Welfare!" My first answer is always the same "NASA." Last fiscal year, the NASA budget was $18.4B. Sure, that's about one half of one percent of the entire federal budget, but imagine what else we could do with $18.4 billion. That's still a lot of money. It's about $118 per federal income tax payer. Relatively peanuts? Maybe to some, but that's also the point.
Some people believe that this is an awesome accomplishment and love the fact that they're helping to pay for it. That's great and I don't want to stop people from doing so. However, I don't want to force everyone else to pay for this as well. My solution is to privatize it.
I would offer all of NASA to Sir Richard Branson for one dollar. He can have the whole thing to do with it as he sees fit. Or, if it could be done, break up NASA into other logical divisions and sell those off to other various corporations, like a Lockheed-Martin, that could do some good with it.
My basic feeling is that if a government organization like NASA does so much good, then the private industry could do it as well. I think the reason that people don't beat NASA at their own game is in part due to the fact that not just anyone is allowed to launch a spaceship to the moon or elsewhere into outer space. Also there's an attitude of why not just join them? It's government funded, so become a partner with NASA or work for them directly.
My feeling is that government should provide infrastructure and defense and to me, NASA doesn't do either one. Flying to Mars really is an awesome accomplishment and all those scientists deserve all the praise in the world (in the universe?) but I just think they shouldn't be publicly funded.
June 7, 2012
How to Fix the RI Economy
I'm sorry, I'm having a hard time writing this as I'm still laughing after reading the article. In the software development field, we often have a joke that any time the Quality Assurance department slows down development due to finding too many bugs in the software, the suggestion is that we should shut down the Quality Assurance department to speed things up again. But we mean it jokingly. Unfortunately, our governor is using that logic for real.
On WPRO.com, Governor Chafee is trying to spin the 60-70 layoffs at the Department of Labor and Training (DLT) as an indication that Rhode Island's economy is improving.
When asked if he really believes that this is a sign that the economy is recovering he said, “Yes, I do. Slowly but surely we are stabilizing, and ticking in the right direction.”Ok Gov, then how do we explain:
In April, the state’s unemployment rate rose for the third consecutive month from 11.1% to 11.2%.Maybe if we bring that all the way up to 12 or 13 percent, then Rhode Island's economy will be really booming?
Governor Lincoln Chafee says the 60 to 70 layoffs coming to the unemployment office at the Department of Labor and Training is an indicator that the Rhode Island economy is recovering.Here's my great idea on how to completely fix the RI economy. If laying off DLT employees means we're improving, then let's simply close the office completely! We can then say we have a great economy because we don't even need a DLT!
Chafee said there are less unemployment requests to process so the office can survive with less staff. “Well the DLT is the opposite of the economy when the economy is bad they are hiring to deal with the unemployment insurance issues and as the economy stabilized unfortunately it goes the other way they start to lay off those employees that they had to hire during the glut of unemployment insurance requests,” said Chafee.We have fewer claims on unemployment insurance, so that means we're improving the economy? Oh boy. Or maybe people have been out of work for so long, their benefits have run out. Or they've just given up. Or they've moved out of state.
Yep, he's our governor. You really couldn't even make this stuff up.
April 20, 2012
"Single, Ready to Mingle"
When even the left is showing disgust for the entitlement system and the issues with it, you know there's a problem. I don't like to use anecdotal examples ("Oh yeah, well I once knew this guy who...") but it's not like this is the right-wing version of Michael Moore out to do a hatchet job. This is Nancy Pelosi's daughter Alexandra doing "person on the street" interviews for Bill Maher's show; he too not exactly someone you might consider to be a conservative.
After all, "it's just food."
(h/t Helen Glover Show)
February 19, 2012

Explaining the Cuts to Services for Developmentally Disabled
Bob Kerr writes about cuts to programs for developmentally disabled people in Sunday's ProJo. My wife worked for some years with adults in this population and I'm aware of the importance of the programs that these individuals and their families rely upon. I also appreciate that they are going to go to great lengths to restore or save these programs. Kerr provides a few examples of the cuts that have been enacted and he quotes the father of one client, Brian Newton:
“I don’t think anyone expected the severity of the cuts,” says Newton, who attended the rally and has been a strong and consistent voice for the disabled. “Since 2003, there has been no budget increase. And in 2008, they started with the cuts. There has been 38 percent in cuts overall.”Well, that piqued my interest. I had a hard time believing there had been no budget increase since 2003. After a review of the "Services for Developmentally Disabled" included in state budgets since 2003, it's readily apparent that, in fact, there have been several budget increases for those programs since that time.
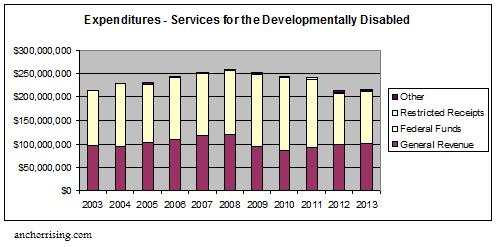
In fact, what has happened is that the programs were funded at around $213 million in 2003 and they were funded at about the same level in 2012 (actually, about a 1% increase). But in between, the funding rose and fell, with the fall coming after the recession hit full force in 2008. That's not "level funded", per se. It is true that since 2008 funding has decreased, but by around 19%, not 38%. (However, Newton may be talking about a specific program and not the overall budget).
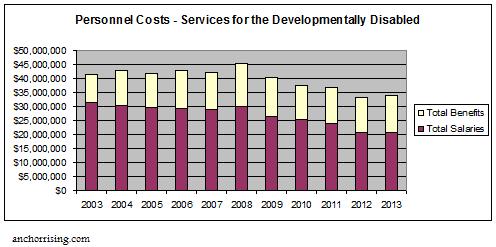
Digging deeper, personnel costs hung around in the $40-45 million range until 2008, when the recession hit, and have decreased ever since (though Governor Chafee's 2013 budget proposes an increase).
The total number of positions funded (FTE's) hung around 612 from 2003 to 2007, when there was a cut of 35 positions, then another 20 were cut in 2008. However, 2009 saw yet another cut of around 90 positions and, since then, there have been around 445-460 positions funded. And while the number of positions declined, the cost/position (salary + benefits) trended upward.
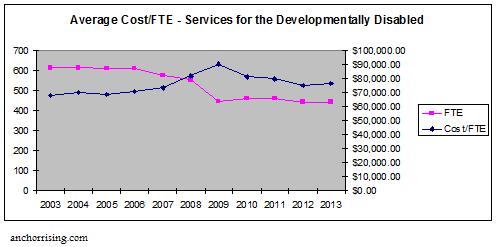
There is a distinct demarcation line in 2009. In that year, when the number of jobs were cut the most, the cost/FTE was at it's largest ($90,500); perhaps some legacy overhead costs? Since then, while the number of funded FTE's has remained relatively stable, the cost/FTE has slowly declined (though Governor Chafee's budget results in a slight increase). Yet, overall, while the cost/FTE was $67,700 in 2003 it was $75,000 in 2012. That includes roughly a 29% increase in the cost of benefits (particularly health care and pensions) since 2003.
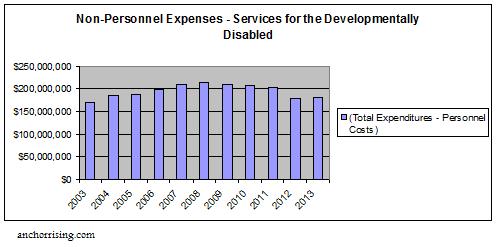
Taking out personnel costs, we see that $170.8 million was spent in 2003 while $180.3 million is budgeted in 2013 (a 5.5% increase). However, the high mark was $213.8 million in 2008, which means, since then, funding for non-personnel related expenditures has dropped nearly 16%.
As the above charts show, costs have basically returned to 2003 levels after rising and then falling. As Kerr's article points out, people feel that services are being cut and it is particularly manifested in the loss of personnel. Even at the return to 2003 funding levels, the number of personnel--boots on the ground--has declined from 613 people to 443 today and, overall, personnel costs have declined from $41.5 million to $33.8 million. Yet, they cost more to employ (about $6,300 $7,300 more) per person. So there are fewer people providing services, which has resulted in a lower level of service than people have come to expect. Hiring 170 people to return to 2003 personnel levels at an average of $75,000 (salary + benefits) would cost an additional $12.75 million. That isn't going to happen right now.
What is the solution? I honestly don't know. Tax increases, if what we're told is true, are a non-starter in the General Assembly. Perhaps a consolidation of services between the various local entities could help with the overhead. Or maybe advocates should help the General Assembly see that a re-prioritization of what we're spending money on is needed. They could also find other areas of the budget to cut or think of ways to save more money in their own budget.
December 23, 2011
Just How Widespread Is SNAP Abuse?
A few days ago, I posted about Christine Rousselle's column in Providence College's The College Conservative and the abuse of food programs like the Supplemental Nutrition Assistance Program (SNAP) previously known as "food stamps". In the comments area, we had a discussion about how widespread the level of fraud actually is as some posted their own anecdotal experiences.
Tonight I found an actual release about the reported levels of fraud and misuse in the plan, as well as the USDA's plans to clean up the problems. I'm sure some will look at this report with the same trust as Cicilline/Esserman crime statistics, but this is all I have to go on.
Over 98% of those receiving SNAP benefits are eligible and payment accuracy was 96.19%And how widespread is the actual documented fraud?
In fiscal year 2010, States conducted 847,136 fraud investigations. In fiscal year 2011, States disqualified 44,483 individuals.I had also mentioned the problem with turning SNAP money into cash. The release claims
Over the last 15 years, USDA has aggressively implemented a number of measures to reduce the prevalence of trafficking in SNAP from 4 percent down to its current level of 1 percent.That is nice that the "SNAP for cash" exchange has dropped that much very often due, as Warrington Faust suggested, to the change from paper coupons to an electronic debit card. However, the USDA admits that there is still about 1% of their budget still being lost to this kind of abuse.
So instead of percentages, what are the hard numbers? These numbers when looked at as percentages, don't look so bad. Thousands of individuals have been removed for fraud and the USDA claims a 1% fraud rate. Scoff all you want, I'm just going by the reported numbers here.
After multiple searches, the only place I could find actual numbers unfortunately is Wikipedia. According to the site, the SNAP program was budgeted for $64.7 billion in 2010. So that 1% fraud and waste? $647 million.
Another vector for that $647 million was also uncovered in Maine, this time in Bangor.
After purchasing a reported 20 24-packs of bottled water, on sale that week for $2.99 a case before taxes and redemption fees were added, the men went behind the store to the loading dock and poured the contents of each bottle on the ground. Shortly thereafter, a reporter also witnessed the pair wheel their shopping cart into the vestibule of the store, feed the 480 bottles into a redemption machine and claim their cash value at the customer service counter.Literally throwing taxpayer money down the sewer.In a ploy a number of the store’s employees describe as common, these men had found a way to turn their funds from the federally administered Supplemental Nutrition Assistance Program, or SNAP, into cold, hard cash, which can then be used to purchase items that do not meet the program’s guidelines.
The total number of people on the SNAP program as of June 2011 was slightly more than 45 million. With that earlier statistic of 44,483 being disqualified from the program due to fraud, that also points to a 1% number of people. Granted, that is the number who were egregious to the point of removal. I don't believe that only those 44,000 participate in fraud nor do I believe everyone who was caught was removed from the program.
So are these numbers massive and widespread? I'll let the reader be the judge of that. In this case, I'm just being the messenger.
October 1, 2011
Grotesque Claim: Reduction of Welfare Benefits A Violation of Due Process
Michigan, in the face of a not unique budget crunch, recently implemented a reduction in social assistance (cash payments) from five years to four with, it should be noted, ample exemptions.
A group of recipients filed a lawsuit to overturn this new, lower cap, which went into effect today. The basis of the suit?
The lawsuit says that the welfare cap violates the due process clause of the 14th amendment. They claim that the cutoff notices were vague and generic. The plaintiffs are asking a federal judge to issue a temporary restraining order against the cap.
Doesn't the right of due process apply only to criminal cases? So by the logic of this lawsuit, should we view these plaintiffs - and all people who participate in social programs - as criminal defendants???
Of course that's a silly question. But it's not as silly as asserting an unrelated constitutional right to secure, not a social benefit, but a larger share of a social benefit.
ADDENDUM
Dan has answered the question in the third paragraph.
No, any constitutional rights having to do with deprivation of life, liberty, or property.Needless to say, due process rights to government handouts are a very recent and "progressive" development in American jurisprudence.
(I'm pretending for the moment that I didn't see Andrew's comment because the concept described therein is simply incomprehensible.)
Link to the Fourteenth Amendment here. Pertinent excerpt:
No State shall make or enforce any law which shall abridge the privileges or immunities of citizens of the United States; nor shall any State deprive any person of life, liberty, or property, without due process of law; nor deny to any person within its jurisdiction the equal protection of the laws.
So there is no presumption of criminality. I stand by the main point: it is grotesque to use this or any Constitutional Amendment to assert either the right to participate in a social program or the right to receive the social benefit in a quantity that the recipient finds adequate.
May 17, 2011
The more things change...
Upon reading that advocates were--surprise surprise--lamenting that our safety net wasn't big enough, a paragraph from the 19th century Irish writer/storyteller William Carleton came to mind. The story is the humorous tale, "Phil Purcell, the Pig-driver" and, as Carleton tells it, the events occurred in a time "unaccompanied by the improvements of poverty, sickness, and famine." With tongue planted firmly in cheek, Carleton continues his ironic portrayal of poverty and a few other "improvements" of his day:
Political economy had not then taught the people how to be poor upon the most scientific principles; free trade had not shown the nation the most approved plan of reducing itself to the lowest possible state of distress; nor liberalism enabled the working classes to scoff at religion, and wisely to stop at the very line that lies between outrage and rebellion.I'm not sure if we can take solace or be distressed from the fact that something written about 250 years ago seems so similar to the situation we're in today. I guess it's one of those incontrovertible characteristics of human nature: there will always be poor people and there will always be those who know better than the rest of us how to "help" them.Many errors and inconveniences, now happily exploded, were then in existence. The people, it is true, were somewhat attached to their landlords, but still they were burdened with the unnecessary appendages of good coats and stout shoes; were tolerably industrious, and had the mortification of being able to pay their rents, and feed in comfort. They were not, as they are now, free from new coats and old prejudices, nor improved by the intellectual march of politics and poverty.
When either a man or a nation starves, it is a luxury to starve in an enlightened manner; and nothing is more consolatory to a person acquainted with public rights and constitutional privileges, than to understand those liberal principles upon which he fasts and goes naked.
February 16, 2011
What Our Welfare State Hath Rot Wrought
Writes Michael Morse at Rescuing Providence:
“I know-lets hook up, you get pregnant, I’ll show up when it’s convenient for me, maybe once a week, maybe twice, maybe not at all, you can be my baby momma, I’ll be the baby daddy, we’ll get RITE care for the baby, and you until the baby is eighteen, or if you have more illegitimate kids, until they are eighteen, I’ll stop by for a booty call now and then, unless I’m with my other baby mommas, but I’ll text you if that’s the case, we’ll drop the kid off at your mom’s house on the weekends and hit the club, or I’ll hang with my boys and you can hit the club and hook up, it’s okay as long as I don’t know.”Fatherhood. It’s a piece of cake. What are all these old guys bitching about.
I wish I was making this stuff up.
Providence is full of single mothers. EMS is used to tak[ing] children from single parent homes to emergency rooms for free medical care. I have no idea what happened, but we need to turn it around before it’s too late.
November 16, 2009

Poverty Institute Breaking Ties with Rhode Island College
This week's Political Scene column in the Projo contains this interesting note at the bottom…
The Poverty Institute at Rhode Island College, a vocal player in the state budget debate, is ending its formal relationship with the public college.I think it's a bit of stretch to say that only conservatives object to the concept of taxpayer funds being used to lobby for tax-increases -- but I'm sure they'll be willing to take the credit for being the most vocal on the issue.The organization announced that this fall, 10 years after its inception within the college’s School of Social Work, it would incorporate as an independent nonprofit entity...
The organization has drawn criticism from conservatives for being a taxpayer-financed entity that regularly lobbies for “revenue-side” budget solutions that raise taxes or fees.
I wonder what new advantages the leaders of the Poverty Institute think they'll gain in a new organizational structure.
ADDITIONAL INFORMATION
Denise Perreault of the Providence Business News has more detail on the impending separation.
August 12, 2009
But is it the Cause or the Effect?
There is now a set of state-by-state listings that Rhode Island has placed near the top of. According to the Substance Abuse and Mental Health Services Administration of the Federal Government's Department of Health and Human Services (as reported in the New York Times), Rhode Island is…
- #1 in the percentage of the population using illicit drugs (12.47%)...
- #2 in the percentage of the population using illicit drugs other than marijuana (5.51%)...
- #1 in marijuana use (16.12%)...
- #2 in cocaine use (4.11%)...
- …but only 6th in binge alcohol use (27.92%).
December 14, 2008
"A Fussy and Difficult Student"
There's a familiar face on the front page of the Providence Journal today:
From the beginning, the relationship between William Felkner and the Rhode Island College School of Social Work has sounded like the screech of chalk on a blackboard. ...Felkner has filed a lawsuit against Rhode Island College that revives arguments from conservatives who have assailed the NASW code of ethics, the profession of social work and the structure of academic programs in schools of social work across the country.
The article reminds readers of a quotation from one social work professor in Felkner's past who succinctly illustrated the attitude that can fester when a group is ideologically cloistered, standing as timely evidence of the need for intellectual diversity and of the opportunity for citizen media, such as blogs, to have an effect by shedding light even in small dark pits:
[Felkner's] complaint about the film prompted an e-mail from his professor, former adjunct faculty member James Ryczek. "Social work is a value-based profession that clearly articulates a socio-political ideology about how the world works and how the world should be," Ryczek wrote.While Ryczek said he wanted to promote an open debate in class, he acknowledged his own liberal leanings.
"I revel in my biases," Ryczek wrote. "So I think anyone who consistently holds antithetical views to those that are espoused by the profession might ask themselves whether social work is the profession for them."
One problem that arises from this particular mentality is that it creates a system whereby public funds are used toward the education of people subsequently tasked with pressuring the public for further funding by a caste of secular sacerdotalists who dictate the methods and means for which acolytes must advocate. Along those lines, note this paragraph, as well:
The School of Social Work and its advocacy arm, the Poverty Institute, favored an "education first" approach to welfare, arguing that training helps recipients land higher-paying jobs in the long run.
A peculiar and tricky business this balancing of "arms," as one can begin to see (for example) in one California union's stewardship of a charitable appendage:
A nonprofit organization founded by California's largest union local reported spending nothing on its charitable purpose -- to develop housing for low-income workers -- during at least two of the four years it has been operating, federal records show. ...The primary mission of the charity -- the Long Term Care Housing Corp. -- is to provide affordable homes for the local's members, most of whom earn about $9 an hour caring for the elderly and infirm. But SEIU officials declined to discuss the charity, saying it is a separate legal entity from the union, even though its board is dominated by officials from the local. The charity is located at the local's headquarters.
In some respects, it's surprising that Bill was able to infiltrate our local cell of poverty advocates as deeply as he did.
September 18, 2008
Poverty Rate Versus Continuous Tax Burden
I've received several e-mails about possible distortions that can arise from plotting a true continuous variable (the relative poverty rate) versus an ordinal rank, and if it's possible to re-plot the data against the data used to create the ranks. Of concern is that ranks can have different meanings at different points on a scale; the difference between slots 1 and 2 might be much larger and much more significant, for instance, than the difference between slots 20 and 30.
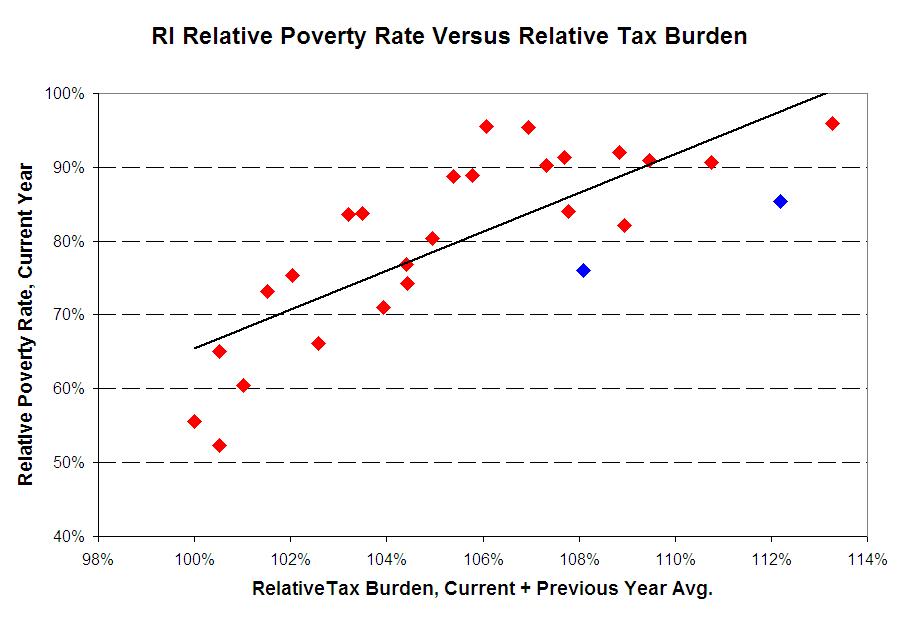
Fortunately, with the data available on the Tax Foundation website, I can express the yearly tax-burden of Rhode Island residents using the same method applied to the poverty rate, in terms of a percentage of the national average. The correlation is as strong as in the continuous-versus-rank plot…
Continue reading "Poverty Rate Versus Continuous Tax Burden"
September 17, 2008
A Declining Poverty Rate Versus a Declining Tax Burden
With all indicators showing the Rhode Island economy tanking at the state level, as well as national and international-level factors like the banking crisis and energy prices squeezing Rhode Island families, it comes as something of a surprise to learn that the Federal Government says that the overall poverty situation in Rhode Island improved during the years 2006 and 2007.
According to the Annual Social and Economic Statistical Supplement put out by the U.S. Census Bureau and the Bureau of Labor Statistics, the poverty rate in Rhode Island in 2007 was 9.5%, its lowest absolute level since 1990. The figure of 9.5% was 76% of the national poverty rate, the lowest relative poverty rate seen in RI since 1994, and the period 2006-2007 was the first time that Rhode Island's relative poverty rate remained below 90% for two consecutive years since 1995-1996 -- probably not coincidentally, around the same time that RI's social services programs were redesigned in response to the Clinton administration's welfare reform initiative.
The new data lets us add two more points to the graph first presented by Anchor Rising last year of relative poverty rate versus Tax Foundation state tax-burden ranking. This graph also incorporates the changes that the Tax Foundation has made to its ranking methodology since last year (which seems to have reduced some of the year-to-year swings in the RI rankings). Here is the scatterplot of current year's relative poverty rate versus previous year's tax burden using the new numbers; the points in blue represent the two most recent years…
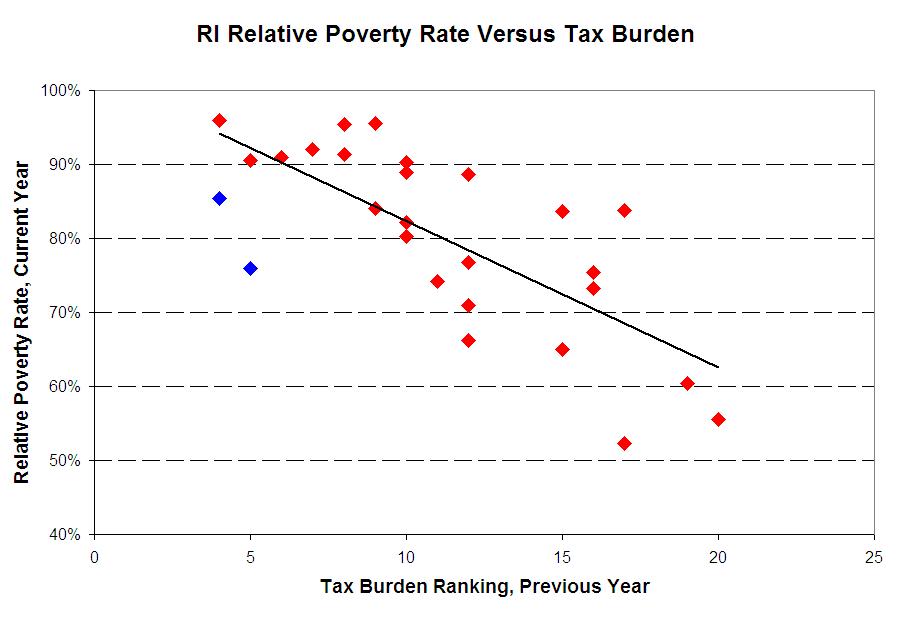
Fans of the Tax Foundation rankings may be interested to know that Rhode Island has fallen out of the top 5 in terms of the taxes paid by its residents. RI "dropped" to 9th place in 2007 and, according to the Tax Foundation's preliminary estimate, to 10th in 2008. It's too early to add a 2007 tax rank versus 2008 poverty rate point to the graph, as 2008 poverty data won't be released by the government until August 2009, but for a possible look ahead, the tax rank of current and previous years can be averaged together and compared to the current year's poverty rate -- for this data set at least, the averaging method produces a tighter fit to the data than by using the previous year's rank alone…
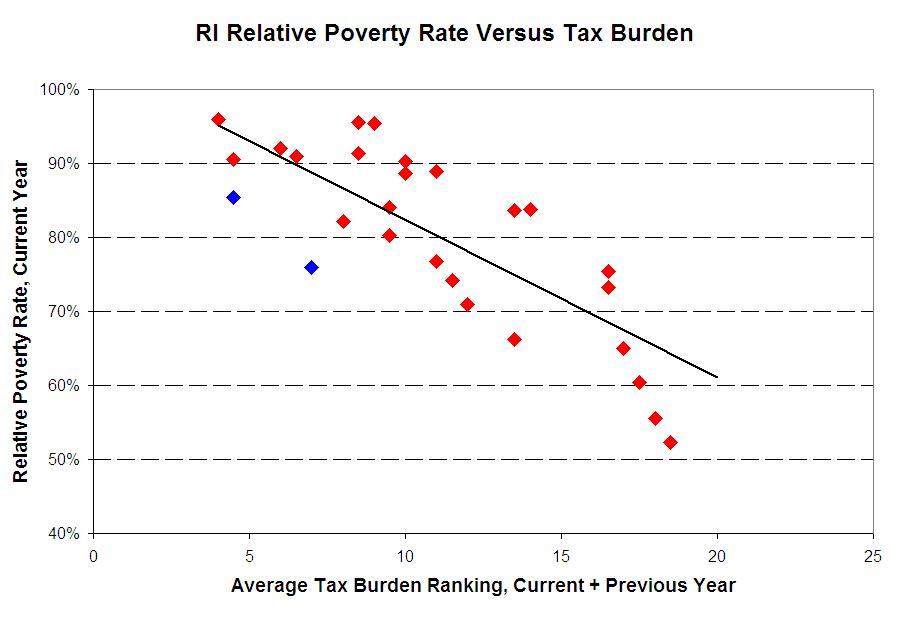
Obviously, there is more than one cause in play creating a result like this, but it is pretty clear from the most recent 25 years of Rhode Island history that creating of a high-tax state is not a great method for attacking the problem of poverty.
Continue reading "A Declining Poverty Rate Versus a Declining Tax Burden"
July 3, 2008
Crossroads and the Issue of Charity
The website of Crossroads, Providence, describes it as "a national leader in providing a continuum of care to the homeless". This post is in no way a criticism of its staff, who are undoubtedly dedicated and work very hard, or of those residents who find themselves in genuine straits.
On his blog Rescuing Providence, in the process of relating his conversation with a young lady he was transporting, Lieutenant Michael Morse says this about Crossroads.
Our rescues are called there daily for assaults, overdoses, drunks and every reason you can think of, then some. The clientele there is poisoned with chronically homeless people who know the system and how to abuse it.
Doesn't this get to the crux of the question of charity, whether publicly or privately funded? If you - in this case, Crossroads - set out to help people, how do you 1.) stop your good intentions and deeds from being abused and 2.) ensure that you are not faciliating an individual's self-destructive behavior?
November 28, 2007
Welfare Cash Time Limits
The ProJo reports:
Thousands of poor Rhode Islanders have received cash welfare benefits for longer than five years, the time limit adopted by state leaders during the sweeping welfare changes of a decade ago intended to push poor families into the work force.The story seems skeptical that much savings can be generated by enforcing time limits because many of those on the rolls are exempt for various reasons. Further, according to the ProJo, these exemptions partially explain how "the state had the third-highest number of recipients on welfare as a percentage of population in the nation last year." Part of that is because around 40% of all cases in Rhode Island are "child only", whereby a child is provided cash instance even if the parent no longer qualifies.Nearly half of the state’s 10,755 families receiving cash assistance last year had been on welfare rolls for more than five years, according to data provided by the Department of Human Services. And nearly one quarter of the families had been on cash assistance for more than 10 years.
And tucked in the story is this bit of data:
Rhode Island is not unusual in its decision to cap welfare benefits at 60 months over a person’s lifetime. Thirty-seven states have a 60-month limit and five states and the District of Columbia have no limit, according to an analysis provided by the Poverty Institute at Rhode Island College.Apparently, we're not that far from the norm after all. Really?
I wasn't sure where the Poverty Institute got it's information. The only reference I could find was in a press release from them, "FIP Facts." Item 10 states, "Rhode Island’s Time Limits are Consistent with the Majority of States. Rhode Island has a 60 month time limit for adults on FIP. Thirty-seven (37) other states have a 60 month time limit and 5 have no time limit." This didn't sound right to me, so I went to the U.S. Department of Health and Human Services web site and dug around. The below table seems to dispute what the RIPI states:
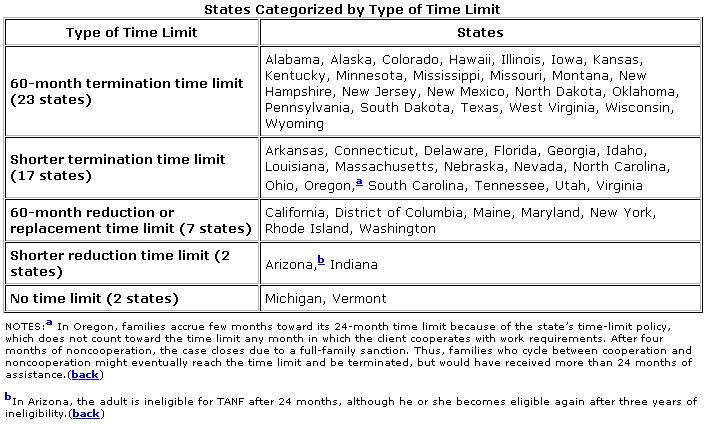
There are also many more supporting tables located here. So how did the Poverty Institute determine that 37 states have a 60 month time limit? They are using the lifetime limits states have implemented, which are often different than consecutive month time limits (these are the "Shorter Termination Time Limit" states in the above table). For instance, in Connecticut you can only receive assistance for 21 consecutive months and are capped at 60 months over your lifetime. In Massachusetts, you can receive assistance for 24 out of 60 months, but there is no lifetime cap.
Additionally, Rhode Island is one of 7 states classified in the above table as "60-month reduction or replacement time limit" which are states that have a 60-month time limit but continue to provide some level of support even after the limit has been reached.
In short, the Poverty Institute didn't tell the whole story. Their numbers imply that Rhode Island is just like the vast majority of states, which have a 60 consecutive month time limit. The truth is that Rhode Island is really only 1 of 7 states that offer 5 consecutive years of regular cash assistance but will continue to pay more for longer if deemed necessary.
November 20, 2007
Brewster Plays with Numbers
Governor Carcieri said, “When I look at our rolls of people receiving ‘family-independence’ [benefits] whether it be RIte Care, whatever, the vast majority of these are women with children and they are not married and this is not a good situation."
To this, Kate Brewster of the RI Poverty Institute responded, "I don’t think anyone wakes up and decides to become a single parent. That notion is absurd...He spoke yesterday of single mothers on cash assistance having multiple children and the facts are that 77 percent of the families on the Family Independence Program have only one or two children. And the idea that single mothers are the cause of our budget woes is also a gross misrepresentation. Today, state spending on cash assistance through FIP accounts for less than one-half of 1 percent of our entire state budget.”
I've already addressed her clever use of the factually correct point that "state spending on cash assistance through FIP accounts for less than one-half of 1 percent of our entire state budget” while leaving out the other programs--such as RIte Care and subsidized Day care--that have essentially replaced cash for services.
Now for the rest...
Brewster said, "I don’t think anyone wakes up and decides to become a single parent. That notion is absurd..." Yes, they all experience immaculate conceptions. C'mon! They should make decisions to ensure that they don't become a single parent in the first place!
Brewster also said, "He spoke yesterday of single mothers on cash assistance having multiple children and the facts are that 77 percent of the families on the Family Independence Program have only one or two children." Well, notice that while the Governor spoke of single moms with multiple kids, Brewster chose to refute this with statistics about "families" with one or two children."
The facts are that--for an equitable comparison--53% of the families on FIP have two or more children. And--given that 8% of the families are defined as two-parent--we can conclude that 92% are single-parent.
The interesting thing is that these numbers are remarkably consistent with past years (read the reports). So even as the total number of those on FIP goes down, the demographic characteristics remains essentially the same. The overwhelming majority are single-parent families and just over half have more than one child. Isn't that what the Governor said?
Welfare Benefits are More than just Cash
"Today, state spending on cash assistance through FIP accounts for less than one-half of 1 percent of our entire state budget,” ~ Kate Brewster, RI Poverty Institute.
The qualifier "cash assistance" makes all the difference, though, and ProJo reporter Katherine Gregg picked it up. As Gregg reports, direct cash assistance has dropped from $58 million in 1996 to $7.7 million today, but--lest anyone is left with the incorrect perception that welfare assistance as a whole "is less than one-half of 1% of the state budget"-- Gregg supplies a couple clarifications:
State officials were unable to produce growth numbers for the popular RIte Care program yesterday. But state spending on subsidized childcare jumped from $6.3 million to $39.1 million during this same period.Yes, we are spending less cash to welfare recipients via FIP than in the past. (Here's the latest report--PDF). However, much of that cash has been converted into government provided services like subsidized day care and health care for the same population. So while $7 million is indeed 1/2% of a $7 billion state budget, the cash from FIP is only part of the equation. And to try to disassociate the infrastructure costs from the actual benefits provided is a bit disingenuous, too. DHS comprises nearly 40% of the budget--that money goes somewhere. Continue reading "Welfare Benefits are More than just Cash"The net result: while the number of people getting cash dropped dramatically, the combined cost to state taxpayers of FIP and childcare went from $57.3 million to $55.3 million.
October 16, 2007
We Don't Have a Tax Revenue Problem
The usual suspects are out complaining about Governor Carcieri's proposed budget cuts:
Even without details, Kate Brewster, executive director of Rhode Island College’s Poverty Institute, said the outcome is predictable and “slashing public services while not addressing the tens of millions of dollars that are being lost to some of the recently enacted tax cuts and tax credit programs is really not fair to the average Rhode Island taxpayer … Capital gains tax cuts, personal income tax cuts, movie picture tax-cuts. We have to ask ourselves whether these are affordable.”Ah yes, the money that is "lost" to tax cuts. That means we're not getting as much tax revenue as before, right? Well, let's see.
For clarity, I'll break them out by category. First, let's see how much less Rhode Island businesses are paying in taxes:
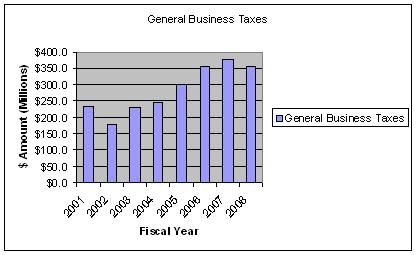
Business tax revenue dipped in 2002 (after 9/11) but had rebounded by 2003/2004. However, it is predicted to dip in 2008, from $376.4 million to $354.9 million. I guess it is around $20 million less...but that certainly bucks the trend that has resulted in about a 50% increase in business tax revenue from 2001 to 2008.
Well, how about Rhode Island taxpayers?
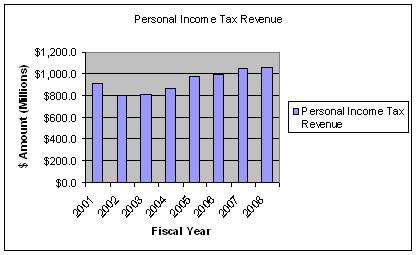
Same sort of trend as the Business tax revenue, though there is no projected "dip" in 2008.
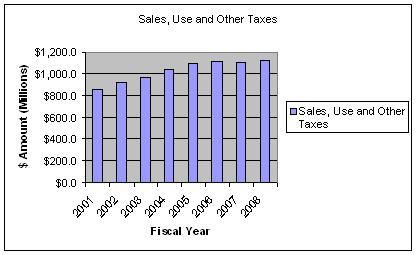
Income tax revenue has continued to climb, increasing by about 30% since 2001. The same trend and percent increase is also true for "other" tax revenue, which climbed from 2001-2005 but have leveled off since then (and that's fine by me!).
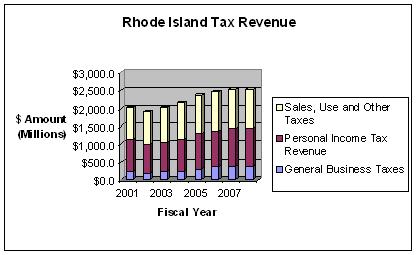
Basically, tax revenue from all sources hasn't gone down (though it will remain essentially the same in both 2007 and 2008). Between 2001 and 2008, it has increased from $2,011.9 to $2,543.6 million (about 26%), but increases in government expenditures have easily outpaced these revenue increases.
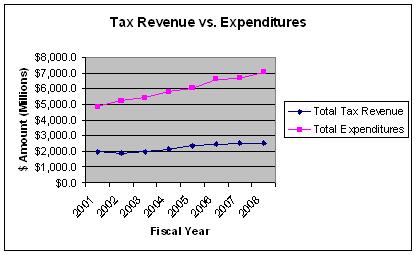
In short, expenditures have gone from $4,839.2 to $7,017 million (about 45%) over the same period.
The horse has been flayed and it's bones turned into meal....but for the millionth time: it's spending, not revenue that is the problem.
All data obtained from the RI State Budget Office web site. Figures for 2001-2005 are actual/audited, for 2006 are revised, for 2007 as enacted in FY budget and 2008 as proposed or projected.
October 10, 2007
It's the demography stupid! (At least partly...)
Mark Steyn pithily sums up a little-discussed truism undergirding many social welfare programs:
This is why I'm opposed to universal social programs - because they were set up on the basis of mid-20th century birth rates.Defined benefit plans and the pending Social Security crisis seem to prove the point, no? He also links to this story about Europe, the laboratory of socialism:
There are currently more elderly people than children living in the EU, as Europe's young population has decreased by 21 percent - or 23 million — in 25 years, 10 percent of which in the last ten years alone...I think the U.S. is holding its own, but the amount of workers it takes to support those not working (elderly, infirm, etc.)--regardless of the population breakdown--is declining. In the acute case of Social Security, demographic shifts are only partially to blame. We also have to "deal" with longer lifespans, which means longer retirements and more benefits paid out. That's why we're down to 3 workers per 1 SS recipient (versus 11 to 1 in the 1930s). That's why something has to change. Don't hold your breath for Washington to solve this one any time soon, though.Italy has the least young people (14.2%) and one out of every five Italians is more than 65 years old... However, the decrease in numbers has been greatest in Spain, where the young population has diminished by 44% in the 1990 to 2005 period...
The decrease has been most significant in new member state Bulgaria, which has lost almost 8% of its population (7.94%) in the last ten years...
On top of that, the number of births across the EU has been decreasing and in some member states, the birth rate is almost two times lower than in the US (2.09 children per family in 2006).
September 7, 2007
DCYF Changes Afoot
The ProJo's Steve Peoples reports:
The Department of Children, Youth and Families is about to fundamentally change the way it does business.However, some are wary:The state child-welfare agency is moving forward with an aggressive plan to rely on a handful of private companies to manage care for Rhode Island’s most vulnerable children. By streamlining services and reducing the number of children taken from their homes, state officials say they can improve the state’s troubled child welfare system while living within a budget that was cut by $60 million this year.
“Rhode Island has relied on many residential programs for too long. Kids need to be in the community, provided that you have the right services for the children,” said DCYF executive director Patricia Martinez. “We’re taking the concepts of 30 years of recommendations and really staying true to our mission: keeping kids safe and making sure families have the resources to really support their kids.”
Child-welfare advocates largely agree with the philosophy behind the new plan, which is dubbed the Family Care Community Partnerships. It follows similar moves in recent years by Massachusetts and New York.
“Good idea. Great concept. But like anything when you’re dealing with people’s lives, you need to make sure you have everything in place. Something like this should take a year or two to do. It’s not something you do in six months,” [state child advocate, Jametta] Alston said yesterday. “They’re saying let’s do this and work out the kinks later. That’s all well and good if I’m knitting. It’s not good if I’m dealing with someone’s life.”Afraid that "dollars are driving" change? Well, what else has worked?! However, it sounds like the cost-savings are secondary and that the real goal is to fundamentally change the way that DCYF does business. The new plan is called "high-fidelity wraparound,” which, on its face, seems to be less about throwing money at the problem and more about really involving families and communities in the process. What is Wraparound (PDF)?Nonprofit leaders across the state echoed Alston’s concerns yesterday.
“The dollars are driving decision making, which is unfortunate,” said Margaret Holland McDuff, chief executive officer of Family Service of Rhode Island, which works with 3,000 children across the state. “To do it this way isn’t realistic. The RFP just came out a couple weeks ago.”
The Wraparound process is a collaborative, team-based approach to service and support planning. Through the wraparound process, teams create plans to meet the needs—and improve the lives—of children and youth with complex needs and their families. The Wraparound team members—the identified child/youth, parents/caregivers and other family and community members, mental health professionals, educators, and others—meet regularly to design, implement, and monitor a plan to meet the unique needs of the child and family...Briefly, the Wraparound process canThere are some important things that "wraparound" is not (PDF):
be described as one in which the team:• Creates, implements, and monitorsWraparound’s philosophical elements are consistent with a number of psychosocial theories of child development, as well as with recent research on children’s services that demonstrates the importance of services that are flexible, comprehensive, and team-based. However, at its core, the basic hypothesis of Wraparound is simple: If the needs of a youth and family are met, it is likely that the youth and family will have a good (or at least improved) life. Much of the early work on Wraparound was focused on children, youth, and their families with very complex needs.
an individualized plan using a collaborative process driven by the perspective of the family;
• Includes within the plan a mix of professional supports, natural supports, and community members;
• Bases the plan on the strengths and culture of the youth and their family;
• Ensures that the process is driven by the needs of the family rather than by the services that are available or reimbursable.However, it is important to note that the process has been proven useful with children, youth, and families at all levels of complexity of need, including those whose needs are just emerging. The intuitive appeal of the Wraparound philosophy, combined with promising initial evaluation studies and success stories from communities around the nation, has promoted explosive growth in the use of the term "Wraparound” over the last two decades. In fact, it has been estimated that the number of youth with their families engaged in Wraparound could be as high as 200,000 (Faw, 1999).
• a “service”AND
• case management
• simply what occurs with a new funding source or the availability of flexible dollars
• merely any service or support that is not typically reimbursable (e.g., respite care, karate lessons, or transportation)
Wraparound is an Alternative to the Typical “Three-Step” Process:Now, apparently there is a difference between just "wraparound" and "high fidelity wraparound," with the difference being on the amount of training the providers receive. The core principals of this approach, laying there behind all of the social-scientific jargon, is that the fundamental units of society--marriage, family, community--need to be re-introduced to this troubled portion of our society:
• Assess problems, assign a diagnosis
• Look around for the services that are available
• Plug services into the family
• Provide what’s available and reimbursable rather than what’s really needed
In considering the history of Wraparound, it becomes apparent that the idea it represents is nothing new. Humans have been creative, and effective, in supporting one another for eons. Building on this seemingly simple idea, Wraparound represents a process that has the potential to be extremely efficient and useful in improving the lives of children, youth, and families.In a perfect world, we wouldn't need the government to teach families and communities how to be, well, families and communities. While a portion of the damage that has already been done is attributable to government enabling in the first place, maybe this approach will help to positively enable individuals and communities to reduce these problems on their own. Call it on the job life-training, if you will.
The cautionary note sounded by Alston should be heeded: do it right, don't rush it. However, so long as the new direction is plotted carefully--and the average DCYF worker buys in--maybe it will help the children and families free themselves from a generational pattern of abuse, neglect and poor choices. "Managing" cases and throwing money at the various problems--no matter how well-intentioned--hasn't worked. It's time to try something different. This may be the first step down that path.
August 31, 2007
The Problem with Relying on the Government
I ended a previous post on the plunging poverty rate with the observation that relying on the government is insidious because such reliance leaves people in the lurch when programs on which they depend get yanked out from under them. Such is the case of the "1,900 to lose childcare aid tomorrow."
I'm sympathetic to their situation. Unfortunately, whenever government has to choose between scaling back or going broke, someone is going to have to bear the burden. In Rhode Island, social welfare programs are usually hit when cuts are made because, simply put, they are one of the largest portions of the budget. The 1,900 are those who were on the margins of an arbitrary qualification line for receiving child care subsidies. Now, they have to find a solution without the government.
Parents are turning to neighbors, friends or even older siblings to care for children who previously attended a licensed facility with trained teachers and staff that offered food and transportation. A total of 1,500 working families will lose subsidies tomorrow. That’s more than 20 percent of the families in the system today.Did you get that? Minus government, they will have to "find creative ways to meet this need." Why did it take government cuts to prompt such "creativity"? {As SusanD adds: "H'mm, like the 'old' days." Yup. It's apparently "creative" to rely on one's own family or community. --ed.}
...“It’s a difficult time. Clearly the state is facing some significant budget challenges. We’re just going to have to deal,” said Karen Leslie, the president and chief operating officer for the YMCA of Greater Providence. “It’s going to be incumbent on us to find creative ways to meet this need. The alternative of children being left home alone is not something we are willing to accept.”
Because when the safety net becomes more like a security blanket, there is no sense of urgency.
Let's also not forget that, according to DHS guidelines:
* Parents choose their provider and may use more than one provider toSo, at least some of the family members and relatives who will be watching the newly unsubsidized kids have been doing it all along. Now they just won't get paid.
meet their child-care needs. Options for care are:
o enrollment in a licensed child-care center or after-school
program;
o enrollment in a certified family child-care home;
o care by an approved relative of the child in the relative’s home;
or
o care by an approved provider selected by the family in the child’s
home.
August 29, 2007
Povery Rate Plunges, but....
According to the Census Bureau--and incoherent indicators aside--the U.S. Poverty rate has decreased significantly. Good news, right? Well, for some...
Elizabeth Burke Bryant, executive director of Rhode Island Kids Count, was quick to hail the findings as “good news for Rhode Island families.”....but not others:
Still, Kate Brewster, executive director of the Poverty Institute at Rhode Island College, called the Rhode Island numbers “unacceptably high” and said they “don’t tell the whole story.”And neither could miss the chance to, well, advocate:“The reality is that the federal definition of poverty is an inadequate measure of the number of Rhode Islanders who are unable to meet their basic needs,” Brewster said. She said the average rent for a two-bedroom apartment in Rhode Island — $965 a month — would eat up nearly 60 percent of the income of a family of four living at the poverty level — $20,650 for a family of that size.
Advocates used the data to bolster their calls to beef up state assistance programs for low-income residents.Cold, hard reality, enter Stage Right:“Rhode Island is clearly making progress,” said Burke Bryant of Kids Count. “We must continue to invest in quality childcare, early education and affordable health care for low-income families.”
Burke Bryant and Brewster praised Governor Carcieri and the General Assembly for increasing financing of adult-education and job-training programs, but criticized cuts to the childcare assistance program for low-income working parents. “Government work-support programs are a lifeline to making ends meet,” Brewster said.
Carcieri spokesman Jeff Neal echoed their support for adult education, but warned that the state’s bleak fiscal prognosis may preclude expanding social-service programs, or even avoiding further cuts. With a projected deficit in the neighborhood of $300 million if the state does not cut spending or raise taxes, the governor has already begun talks with his department heads about how to close that gap.OK, no surprises. But Robert Rector at Heritage has studied the data and reminds us that "poverty" is a little different in the U.S. of A. then the rest of the world:“Unfortunately, the state is facing yet another very difficult budget year,” Neal said. “Our primary challenge is to find ways to reduce state spending while continuing to protect our most vulnerable citizens.”
For most Americans, the word "poverty" suggests destitution: an inability to provide a family with nutritious food, clothing, and reasonable shelter. But only a small number of the 37 million persons classified as "poor" by the Census Bureau fit that description. While real material hardship certainly does occur, it is limited in scope and severity. Most of America's "poor" live in material conditions that would be judged as comfortable or well-off just a few generations ago. Today, the expenditures per person of the lowest-income one-fifth (or quintile) of households equal those of the median American household in the early 1970s, after adjusting for inflation.With regards to children, Rector concludes:
...The typical American defined as "poor" by the government has a car, air conditioning, a refrigerator, a stove, a clothes washer and dryer, and a microwave. He has two color televisions, cable or satellite TV reception, a VCR or DVD player, and a stereo. He is able to obtain medical care. His home is in good repair and is not overcrowded. By his own report, his family is not hungry and he had sufficient funds in the past year to meet his family's essential needs. While this individual's life is not opulent, it is equally far from the popular images of dire poverty conveyed by the press, liberal activists, and politicians.
The main causes of child poverty in the United States are low levels of parental work, high numbers of single-parent families, and low skill levels of incoming immigrants. By increasing work and marriage, reducing illegal immigration, and by improving the skill level of future legal immigrants, our nation can, over time, virtually eliminate remaining child poverty.Additionally, Rector doesn't think welfare reform has gone far enough and notes that there are no work requirements for recipients of food stamps and public housing and that "the welfare system continues to encourage idle dependence rather than work and to reward single parenthood while penalizing marriage."
Brewster et al would have us continue to raise the amount we spend on child-care assistance programs because, they say, that is the only way that single-parents can afford to go to work. Perhaps. But for families with two parents another solution is the one followed by my parents and, I'm sure, millions of others: work more, and work in different shifts so that one parent is always home with the kids. That's nothing new, folks. But it's hard, which I fully recognize.
And that's what makes falling back on the government such and easy, and insidious, "temporary solution." It de-motivates and fosters an unhealthy reliability that leaves people in the lurch when programs they depend on get cut, whether because of a politician's whim or for because of government fiscal problems.
August 17, 2007
DCYF Asks for More
Rhode Island must hire almost 50 social workers at the state's foster care agency to meet national guidelines. That's according to testimony today from Patricia Martinez, the director of the Department of Children, Youth and Families.Like it or not, and altruism aside, more workers cost more money. And right now, DCYF hasn't shown an ability to be able to abide by a budget:She spoke before a state Senate committee investigating how DCYF handles children in foster care. A federal civil rights lawsuit filed this summer alleges that the agency failed to stop the abuse and neglect of some children in its care.
The lawsuit by the state's child advocate alleges that DCYF social workers are overwhelmed -- especially in its Providence office.
A national advocacy group recommends a standard of 14 families per caseworker. Martinez says achieving that goal would require hiring 44 social workers and four more supervisors.
Fifteen new social workers are starting the job in September.
The DCYF is on pace to spend its entire first-quarter child-welfare budget by mid September, agency director Patricia Martinez said yesterday. And a provision passed in the state budget prevents state officials from shifting money to cover the shortfall until the beginning of the second quarter, Oct. 1.Now for some math. In FY 2008, the budget contains the following for Social Caseworkers and Supervisors (dollar values include cost of salary and benefits):...the situation is also complicated by the Assembly’s decision this year to release the DCYF’s financing in four quarterly payments in an attempt to control department overspending — a control applied only to DCYF this year, according to House Finance Committee Chairman Steven M. Costantino.
“We were very concerned about overspending in DCYF. Every year they would come to the Assembly for a supplemental request and we’d find out that a half year has gone by and they’ve already blown by their budget,” Costantino said.
Last year, for example, the Assembly approved a $17.9-million supplemental appropriation (including federal dollars) at the end of the session on top of the DCYF’s $293-million budget.
The quarterly allotments, Costantino said, were a safeguard put in place after the Assembly agreed to restore partial financing for services to 18-to-21 year olds in state care, which the governor had proposed cutting. The plan also required the DCYF to redesign its system to save money by improving department inefficiencies.
“There has not been a lack of money for DCYF over the years,” Costantino said. “Unfortunately, it seems that there has to be a major financial crisis to make change.”
| Position | Number | Total Cost | Cost/FTE |
|---|---|---|---|
| Chief Casework Supervisor | 6 | $575,288 | $95,881 |
| Senior Casework Supervisor | 2 | $171,742 | $85,871 |
| Casework Supervisor II | 51 | $3,791,322 | $74,340 |
| Social Caseworker | 1 | $60,720 | $60,720 |
| Social Caseworker II | 233 | $13,280,321 | $56,997 |
| TOTAL | 293 | $17,879,393 |
Adding 44 more Caseworkers--and I'm assuming they would be at the lower, and more numerous, "Social Caseworker II" rate rather than the regular (perhaps grandfathered?) Social Caseworker rate--would cost $2,507,868.
Adding 4 more supervisors--assuming at the CS II rate--would tack on $297,360 for a grand total of $2,805,228 to bring Rhode Island's DCYF in line with the recommendations of a "national advocacy group." The result would be $20,684,621 earmarked to personnel costs for caseworkers. One caveat: this is if we use 2008 numbers, not projected (at a what, 4-5% increase per FTE?) 2009 numbers.
Martinez's request for more caseworkers also helps to determine the current number of DCYF cases. Assuming each caseworker is to have 14 cases and there would be 278 Social Caseworkers, that works out to 3892 cases. I'm not sure if Supervisors also have a distinct caseload over and above those of the caseworkers they manage. Even if they do, that still puts the total caseload at around 4,000.
Like it or not, personnel costs aren't going down and the bottom line is that DCYF is going to require an additional $3 million. Where is it going to come from? And can we trust DCYF to spend the money wisely? Democrat House Finance Chair Constantino obviously doesn't and DCYF has done nothing to prove him wrong.
Look, "screwing the youth" isn't the way to go, but, as I've written before, those who are charged with protecting our most vulnerable kids simply have to be more fiscally responsible and get their priorities in order. Kids first, perks second.
July 8, 2007
From Pixel to Paper
Yes, that's my piece about DCYF's structural problems found on this morning's Providence Journal editorial page, nestled between the Editor's thoughts on NY Mayor Bloomberg's possible presidential run and Froma Harrop's piece on the house swallow. Of necessity--no surprise--I had to boil down the information I provided in my lengthier posts hereabouts (here and here), so if new visitors are interested on where I got the numbers, please follow the links. Finally, there is also an informative piece by the ProJo's Steve Peoples on well-meaning Child Advocate Jametta Alston, who brought the problems at DCYF more directly into the light.
July 3, 2007
RE: DCYF's Problems
Pat Crowley--who throws ad hominem attacks around like a Fenway Park Vendor throws peanuts (though they're more accurate)--has peeked in to drop a couple bombs concerning my DCYF post. However, he did attempt a more substantive critique at Kmareka (a post which Justin already mentioned). Crowley thinks that my calculations don't take into account compounding of salaries--"each year the raises are on the raises from the prior year"--and that they "are skewed because they count certain things twice....Vacation, for example. If I get to take a week off, I get paid right? But I don’t get paid twice. AR...count[s] my regular salary AND my vacation pay… they count it twice, in other words."
To start with, there was no intention to shape the stats to fit my argument, as he implied. I kept hearing how the overall budget has increased so much since 1998, that I got the State Budge docs from as far back as I could (2001) and proceeded from there. My "technique" was simple: crunch some numbers in a straightforward way and post the results. The 29% increase in salary per position since 2001 was derived from the difference of the average DCYF salary then ($47,500) until now ($61,300). But the increase in the total amount devoted to salary from year to year is only part of it: the other part is the reduction in the number of positions and how, taken together, there has actually been an overall increase of salary per position.
I think most people would ask: has my salary increased 29% ($13,800) since 2001? But let me amend that: these increases are for positions, not people. A better question would be: has my salary increased 29% ($13,800) since 2001 even though I've never been promoted?
OK, you asked for it: more fun with tables. As they say, there are lies, damn lies and statistics, right? Well, here is a year-to-year breakdown that may assuage Crowley's compounded concerns.
| Year | # FTE's | % Change # FTE's | Total Salary ($Mil) | % Change Ttl. Sal. | Avg. FTE Salary | % Change | Inflation Rate |
|---|---|---|---|---|---|---|---|
| 2001 | 875.9 | - | $41.7 | - | $47,600 | - | - |
| 2002 | 875.9 | 0% | $45.8 | 9.8% | $52,300 | 9.9% | 2.83% |
| 2003 | 868.9 | -<1% | $48 | 4.8% | $55,200 | 5.5% | 1.59% |
| 2004 | 853.8 | -1.8% | $46.4 | -3.4% | $54,400 | -1.5% | 2.27% |
| 2005 | 851.8 | -<1% | $47 | 1.1% | $55,200 | 1.5% | 2.68% |
| 2006 | 849.8 | -<1% | $49.7 | 5.7% | $58,400 | 5.8% | 3.39% |
| 2007 | 821.8 | -3.4% | $49.5 | -2.9% | $60,200 | 3.1% | 3.24% |
| 2008 | 810.0 | -1.5 | $49.7 | +<1% | $61,300 | 1.8% | 2.51% |
As the table shows, calculating things in a slightly different way reveals that changes in total salary for the entire DCYF aren't exactly the same as changes in the average salary per FTE position. If anyone wants to suggest alternate methods, feel free.
Crowley's example re:vacation might be applicable when calculating total payroll (salary and benefits). I used the budget numbers by the state to calculate total payroll per Full Time Equivalent position. Genuine question: Is he saying the State--including the Budget office and the Legislature--has been using faulty math for at least the past decade in calculating those numbers?
ADDENDUM: In the comments, "Bobby O" believes I'm excluding important comparative data. I've added Inflation rate to the above table. Bobby also believes that I'm not taking into the number of caseloads. Well, according to RI Kids Count:
Between 2000 and 2005, in Rhode Island, the total Department of Children, Youth and Families (DCYF) caseload remained relatively constant at around 8,000 cases. In 2006, the number of children on the DCYF caseload increased to 9,414, a 19% increase from 2005.That's the most up-to-date I can find. Bobby ties the high caseloads to the need for the State to make an attractive compensation package to lure workers. My first thought was, "where are all of the altruistic RIC grads?", but the question really goes back to the argument made before: slightly less compensation = a few more workers = lighter caseloads = better service.
Hey Bobby, here's a thought. If you want to cut jobs in one place to add more workers at DCYF, why not turn your eyes to the Legislature? (Hey, I can play this game all day).
| 2001 | 2008 | Change (Value) | % Change | |
|---|---|---|---|---|
| Total FTE's | 260 | 298.2 | +38.2 | +11% |
| Total Salaries | $12,223,039 | $18,952,525 | +$6,729,486 | +55% |
| Total Salary/FTE | $47,012 | $63,556 | +$16,544 | +35% |
| Total Salary+Benefits | $18,952,525 | $29,396,150 | +$10,443,625 | +55% |
| Total S+B / FTE | $64,463 | $98,579 | +$34,116 | +53% |
The numbers speak for themselves.
June 29, 2007
DCYF's Problems: A Matter of Fiscal Priorities
The ProJo reports:
Rhode Island's Child Advocate Jametta O. Alston is pursuing class-action status on behalf of the 3,000 children now in state custody, aiming for nothing less than an overhaul of Rhode Island’s child-welfare system, which the suit portrays as overburdened and mismanaged.Alston claims there are some very real problems going on at DCYF.“It’s beyond broken,” Alston said of the system. “It’s demolished. It doesn’t work.”
Rhode Island was the worst in the nation in the number of children abused and neglected while in state foster care in five of the six years between 2000 and 2005, according to the suit. “We beat Mississippi and Alabama,” Alston said. “Think about that.” {Note: the ProJo corrected this statement on Saturday to read "rate" instead of "number" of children--ed.}
...caseworkers are laboring under “excessive caseloads”; the state places too many children in institutions, group homes and emergency shelters; and children are being “reunited” with parents who have abused them.If her claims are true, then the children are being twice-victimized. It's a disgrace. As Alston wrote in the OCA's 2006 report, night to night placement shouldn't even be going on:
...DCYF provides the OCA weekly reports identifying children placed night to night. These reports indicate that more than two decades after the original lawsuit was filed, DCYF continues to rely on night to night placements. The reported total number of children placed night to night in 2006 is 234. The reported total number of night to night placement episodes for the 2006 year is 276...Here's an idea: why not spend, say, $71 million on a facility to hold these poor kids instead of moving them around every night? Then again, maybe a central facility may not be the best idea. According to the same report, there have been problems at the Rhode Island Training School, too. And when the OCA tried to address them, well...
During 2006, the OCA, RITS, CPS [Child Protective Services] and Council 94, Local 314 of the American Federation of Federal, State and Municipal Employees (AFSME) met numerous times as the parties attempted to work out investigative protocols which protect the child’s and worker’s respective rights without compromising the integrity of the investigative process and without draining the limited workforce resources of RITS. All parties had a shared concern for the safety and wellbeing of the residents but each time it appeared that there was agreement on the protocols, Council 94 would subsequently object to the OCA’s participation in the investigation. This led the OCA to reevaluate the protocols and its proposal for protocols for future investigations.However, in the end, the OCA, in the aforementioned 2006 report, requests that more workers and money be appropriated to address the various problems. I appreciate the motive, but I think the "fix" is wrong-headed and will only enable the same attitudes and--tell me where you've heard this before--structural problems that have gotten DCYF into this mess. Besides, this is exactly what the State has been doing.
From 2001 to 2007, the amount budgeted for DCYF went up from $195,121,687 to $290,358,510, an increase of 48.8%. However, despite the pleas of Alston and groups like the RI Poverty institute, the Enacted 2008 State Budget saw a reduction of expenditures for DCYF down to $232,749,891 (though that is still an increase of 19% over 2001).
We all want to help poor kids in troubled families, but throwing more and more money at the problems hasn't helped. Yet, neither does it seem logical to take away money, right? But looking at the overall DCYF budget doesn't tell the whole story. In fact, there is one area where the growth hasn't subsided at all: payroll.
In 2001, there were 875.9 FTE (Full Time Equivalent) positions whose salaries totaled $41,667,680, for an average salary of $47,571 per FTE. In 2008, there were 810 FTEs with a total salary component of $49,698,858, for an average of $61,357 per FTE. That's an overall average salary increase of 30% over 7 years. That's around a 4% increase per year (the inflation rate from 2001 to 2006 was around 2.5% and hasn't increased). Meanwhile, the total number of FTEs has decreased by 66 positions. How is such a reduction helpful to the workloads?
And the numbers really jump when the total payroll costs (salary and benefits), which more accurately reflect the real cost to government--and taxpayers, are used. By adding benefits (Retirement, Medical, Medical Benefits Salary Disbursement and FICA) to the previous calculations, in 2001 there was a total payroll cost of $55,574,096 or $63,448 per FTE. In 2008, there was a total payroll cost of $76,652,769, or $94,633 per FTE. That is a net loss of 65.9 jobs (-7.5%) between 2001 and 2008, but an increase in payroll of $30,515.55 per FTE (+49%).
OK, so which job salaries are increasing the most, right? I suspect we'd hear an argument that all the money is going to upper management and administrative positions. Let's take a look.
| Position | 2001 Cost | 2007 Cost | % Difference |
|---|---|---|---|
| Director, Dept. of Children, Youth & Families | $118,719 | $145,952 | 22.9% |
| Executive Director, Administration* | $115,754 | $151,848 | 31.2% |
| Administrative Assistant** | $37,073 | $54,975 | 48.3% |
| Deputy Director, (DCYF) | --- | $110,906 | 100% |
| Associate Director, Child Welfare | --- | $132,968 | 100% |
| Executive Assistant | --- | $74,067 | 100% |
*Now called "Executive Director, Administration (DCYF)"
**Now called "Confidential Secretary"
The increases in these positions average in the 30% range (though the Secretary saw an increase of nearly 50%--hmm, maybe it's not just privatized secretaries who make out...). Plus, 3 new positions were created.
OK, let's compare the increase in the costs of employment for a few "in the trenches" positions between 2001 and 2008. By the way, I didn't cherry-pick these positions, folks. I simply went through and tried to find the positions with higher numbers of employees, figuring that they were the "average Jill or Joe" workers.
| Position | 2001 FTE | 2001 Cost | 2001 $/FTE | 2008 FTE | 2008 Cost | 2008 $/FTE | $/FTE % Increase |
|---|---|---|---|---|---|---|---|
| Probation & Parole Counselor II | 34 | $1,775,898 | $73,995.75 | 37 | $2,685,984 | $72,594.15 | -1.9% |
| Juvenile Program Worker | 121 | $4,327,711 | $35,766.20 | 140 | $6,320,414 | $45,145.80 | 26.2% |
| Casework Supervisor II | 54 | $2,912,108 | $53,927.90 | 51 | $3,791,322 | $74,339.65 | 37.9% |
| Child Protective Investigator | 67 | $3,308,487 | $49,380.40 | 68 | $4,700,377 | $69,123.20 | 40% |
| Social Caseworker II | 264 | $10,867,031 | $41,163.00 | 233 | $13,280,321 | $56,997.10 | 38.5% |
Now, over the years, the total FTEs have gone up and down for some of these positions, but in most cases, the payroll costs to employ fewer workers have gone up. With this un-scientific sample, the average payroll cost of one position went down (negligibly), while the rest went up. And of those, 3 of the 4 saw increases closer to 40%.
It can be concluded that most of the (few) lost jobs occurred at the front-lines (the Social Caseworker II is a case in point) and it is no wonder that these workers--who deal day-to-day with society's hard-cases--feel like they're doing more than before. But they're certainly not doing it for less and their annual compensation has increased, generally speaking, on par or better than that of the DCYF administrators and managers.
I guess the question is this: would these employees--or their unions--be willing to sacrifice a portion of their "traditional" salary and benefit increases so that more people could be hired to help with the caseloads? Maybe tying state salary increases to cost-of-living increases or inflation would help. And, for sure, the benefits packages need to be overhauled. If only.
In summary, DCYF has very real problems, but these are rooted in the same structural inefficiencies that are affecting the entire State Government. Until these inherent structural problems--over-generous increases in both salary and benefit packages and much-needed administrative consolidation to name a couple-- are fixed, we will continue to shortchange both the end-user of government services and the people whose taxes pay for them.
I don't intend to demean or belittle the workers in the State's DCYF. They are harried and hassled and most still do their best to care for their charges. But there is only so much money that can be thrown their way. Unless something is done, the cost to employ them will continue to go up even as fewer of them perform more work. And no matter their heroics, there is only so much time in the day.
There can be no doubt that we need to fix these structural problems for the health of our government and State. We need to make the cost of employing all state workers cheaper, thus enabling the State to employ more of them to provide adequate services. But fixing our "structural problems" needs to be done for more than the well-being of the state. As the ongoing problems at DCYF illustrate, we need to do it to help our most vulnerable kids. They're our future, one way or another.
SOURCES: 2001 RI Budget Personnel Supplement; 2007 DCYF Personnel Budget Supplement; 2008 DCYF Personnel Budget Supplement
May 30, 2007
Expand Welfare Reform, Don't Raise Taxes
Instead of the predictable call for tax hikes, how about looking at things in a different way (h/t) :
Imagine a line composed of every household with children in the United States, arranged from lowest to highest income. Now, divide the line into five equal parts. Which of the groups do you think enjoyed big increases in income since 1991? If you read the papers, you probably would assume that the bottom fifth did the worst. After all, income inequality in America is increasing, right?How did this happen?Wrong. According to a Congressional Budget Office (CBO) study released this month, the bottom fifth of families with children, whose average income in 2005 was $16,800, enjoyed a larger percentage increase in income from 1991 to 2005 than all other groups except the top fifth. Despite the recession of 2001, the bottom fifth had a 35 percent increase in income (adjusted for inflation), compared with around 20 percent for the second, third and fourth fifths. (The top fifth had about a 50 percent increase.)
Even more impressive, the CBO found that households in the bottom fifth increased their incomes so much because they worked longer and earned more money in 2005 than in 1991 -- not because they received higher welfare payments. In fact, their earnings increased more in percentage terms than incomes of any of the other groups: The bottom fifth increased its earnings by 80 percent, compared with around 50 percent for the highest-income group and around 20 percent for each of the other three groups.
Low-income families with children increased their work effort, many of them in response to the 1996 welfare reform law that was designed to produce exactly this effect. These families not only increased their earnings but also slashed their dependency on cash welfare. In 1991, more than 30 percent of their income was from cash welfare payments; by 2005, it was 4 percent. Earnings up, welfare down -- that's the definition of reducing welfare dependency in America.Yes, why not? The author, Brookings Institute senior fellow Ron Haskins, recommends a couple new policies:But now consider that the next-biggest increase in income for the bottom group was from the earned-income tax credit (EITC), a program that, in effect, supplements the wages of parents with low incomes. In addition, most of the children in these families had Medicaid coverage and received free school lunches and other traditional social benefits. In other words, this success story is one of greater efforts to work more and earn more backed by government benefits to improve living standards and, as President Bill Clinton used to say, "make work pay."
This increase in earnings and total income by low-income families is the biggest success in American social policy of recent decades. So why not broaden it?
1) Expand the work requirements tied to receiving food stamps and housing.
2) "[I]mprove...programs that help low-income workers such as child care and health care."
Haskins says this can be done by
[ending] earmarks, agriculture subsidies and ineffective programs such as Title I of the No Child Left Behind Act and used the money saved to increase support for low-income working families by expanding the EITC (especially for poor men who work full time), as well as child care and health-care coverage. Without increasing the deficit, Congress could augment the progress being made by low-income families, help them increase their standards of living and income mobility, and further strengthen the politics of personal responsibility. This should be an agenda on which Republicans and Democrats can unite.Just a thought.
May 25, 2007
The Return of the Progressives Against Science Education
Actually, it’s doubtful that they ever left. Jim Baron of the Pawtucket Times notes that the members of the Campaign for Rhode Island’s Priorities, as they did last year, want to cut Governor Donald Carcieri’s science education initiatives out of the state budget in order to fund non-educational social service spending…
A coalition of social action groups, the Campaign for Rhode Island's Priorities, wants lawmakers to roll back a number of tax breaks for corporations and the wealthy, increase some other taxes and reduce or eliminate funding for charter school spending, science and technology education and information technology improvements. At the same time, it wants to see spending hiked for several human services programs and to preserve others now on the chopping block.Specifically, the CRIPs want to save $3,000,000 by “postponing” implementation of the Governor’s Inspiring Excellence in Science, Technology, Engineering, and Mathematics program. But because the CRIP package does not address the structural nature of Rhode Island’s shortfalls, adopting its philosophy would likely require a "postponement" of the program that never ends in order to balance future budgets.
Here’s the description of exactly what the CRIPs would like to eliminate, as described in the Governor's budget proposal…
To support more efficiencies and better training in the educational system, the Governor’s plan includes previously approved funding of $15.0 million for technology over five years which would focus on “Inspiring Excellence in Science, Technology, Engineering, and Mathematics (STEM)”. The Governor recommends funding for innovative technology to upgrade teacher training programs to better prepare teachers to inspire their students to excel in science, technology, engineering and mathematics. Projects that qualify may include, but are not limited to, the Rhode Island Department of Education’s Comprehensive Education Information System and its rollout to school districts as well as specific funding to support teacher professional development in the use of innovative technologies or techniques, including our state’s teacher preparation programs. The “SMART” Classrooms Program will significantly upgrade teacher preparation facilities at Rhode Island College and the University of Rhode Island by infusing technology into our teacher training programs, creating a Center for Excellence in Mathematics, Science and Technology Education, and upgrading mathematics and science classrooms and laboratories.According to their press release, CRIP membership includes the National Education Association of Rhode Island and the Rhode Island Federation of Teachers and Health Professionals, which would seem to put Rhode Island’s teachers unions on the side of science education cuts. Is it indeed the position of the unions that science education is the first area of the state budget where spending should be reduced in a time of fiscal crisis?
Finally, in the Pawtucket Times article, Ocean State Action director Karen Malcom calls the CRIP package “common sense”. Apparently, to Ms. Malcom, it is common sense that welfare spending takes priority over education. That explains why the members of CRIP are willing to increase taxes to spend on social services, but not to improve education.
May 2, 2007
Reforming DCYF
A special commission put together by the Governor to look into ways to reform DCYF has handed in its report.
The report’s primary recommendation is to reform how the DCYF cares for children in its custody. According to the review team, the DCYF served 11,329 children last year, about 9,000 at any point in time. Of these, 1,210 were in residential care, including the Rhode Island Training School. “Residential expenses will account for approximately two-thirds of the department’s expenditures,” the panel wrote. “Thus, 13 percent of DCYF’s clients are consuming 67 percent of its budget.”Housing a child at the Training School costs $98,000 / year, so there must be some way to reduce the cost or, at least, the amount of kids being sent there. This is just the first step in reform. Let's see what roadblocks get thrown up along the way....the review team urged the DCYF and “external stakeholders,” such as the Family Court, to agree on a plan to limit residential placements, to develop “appropriate alternatives,” and to eventually reduce the number of beds in the system. Jane Hayward, state director of health and human services, said lower-cost alternatives could include placing children who have behavioral or medical problems with specially-trained foster parents. Or keeping children at home or in foster homes and using outside services from the community to meet their needs, she said.
The review panel also called for: resolving an ongoing bottleneck in foster care licensing; renegotiating union contracts to include flex work time; inclusion of DCYF caseloads in the state’s twice-annual caseload estimating conference; working to have fewer children sentenced to the Training School, when less restrictive environments would do; and better management of overtime expenses.
March 15, 2007
Re: Is Rhode Island a Welfare Draw?
The poverty advocates' stratagem of legerdemainically misleading the public about Rhode Island's welfare system by focusing on TANF numbers has been repeated for years. It caught my attention back in 2004, and assuming that they still apply, some of my points from then may serve to supplement Andrew's posts (here and here).
TANF dollars aren't the only cash handouts available in Rhode Island:
SSI, or Supplemental Security Income, is a federal program that provides monthly cash payments to people in need. SSI is for people who are 65 or older, as well as for blind or disabled people of any age, including children. ...The state of Rhode Island adds money to the federal payment. The single payment you get in the beginning of each month includes both the federal SSI payment and your supplement from Rhode Island.
Rhode Island adjusts TANF payments based on other income less than other states do (from my old post):
The folks not included in this analysis are those who have some form of other income. To understand why this matters, consider what looks to be the comparable program in Massachusetts. ... That single mother of two will, indeed, receive $633 per month in Massachusetts if she doesn't live in subsidized housing. However, her income (after certain deductions) is directly subtracted. So, suppose she gets $200 from some other source. In Massachusetts, her monthly cash gift would be $433, with $633 remaining her monthly income.In Rhode Island, on the other hand, her base benefit would be $554, and the first $170 of additional income isn't counted. Moreover, the cash benefit is only reduced $1 for every additional $2 of income. For the woman making $200, that would result in a $15 reduction. So, this same woman who was capped at $633 in Massachusetts would take home in Rhode Island: 554 + 200 - 15 = $739. And in fact, the percentage of those who benefit from FIP who are working rose from 13.7% in 1997 to 21.3% in 2003, which has been at least part of the reason for [the decrease in Rhode Island expenditures for cash assistance.]
But the real bloat is in child care and healthcare, which helps to explain the difficulty in tracing the degree to which RI's welfare system draws the poor to our state:
In fact, all Rhode Island households earning no more than 225% of the federal poverty level are eligible for child care subsidies, with copays ranging from $0 to $48 per child per week. For a family of four ... that means annual income of $42,413. According to the U.S. census, the median household income in Rhode Island for 2000 was $42,305. Rhode Island apparently considers half of its families to be "low income."From a taxpayer point of view, it's also interesting to note that, to encourage child care providers to accept poor children, they get fully paid healthcare. And healthcare opens a whole 'nother stack of taxpayer bills. Every family receiving cash payments from the government is eligible for it. Every family with income up to 185% of the federal poverty level ($34,873 for a family of four) is eligible. And every child under 19 and pregnant woman with household income of 250% FPL is eligible. If the household makes less than 150% FPL, the insurance is free, otherwise there are relatively tiny monthly payments of $61, $77, $92.
ADDENDUM:
One mild adjustment to Andrew's reference to the five-year limit for TANF: That's the limit that the federal government puts on the program, but states may opt to shorten it.
Is Rhode Island a Welfare Draw? Part 2: Some Statistics
The benefit policies that according to critics of Rhode Island's welfare system are drawing people to Rhode Island in search of public assistance came online in 1997, when the old Aid to Families With Dependent Children (AFDC) program was replaced at the Federal level by Temporary Assistance to Needy Families (TANF). States also had to change their welfare policies in order to comply with the new Federal rules. In Rhode Island, the required changes were implemented through what is called the Family Independence Program (FIP).
1997 was a watershed year with respect to social welfare policies in Rhode Island for another reason. The beginning of FIP marked the end of a decade-long run of the poverty situation in Rhode Island being consistently better than in the rest of the country. According to Census Bureau statistics, the 1996 poverty rate in Rhode Island was 80.3% of the national rate. That marked only the second time since 1985 that poverty in Rhode Island had risen to greater than 80% of the national rate (the other bad year was 1992, when poverty in RI was 83.8% of the national rate). From 1997 onward, the poverty rate in Rhode Island has never dropped below 80% of the national poverty rate. Complete data is available in the table below.
The most recent statistics tell an even more interesting tale. In 2002, poverty in Rhode Island suddenly rose by 14.6% over the previous year, bringing the poverty rate in Rhode Island to 90.9% of the national rate. The spike was not a one-year anomaly. Since 2002, poverty in Rhode Island has never dropped below 90% of the national rate. The years between 2002 and 2005 mark the only time since 1980 where Rhode Island's poverty rate has exceeded 90% of the national poverty rate for four consecutive years. (The second worst stretch in recent history would be the three consecutive years over 88% between 1982 and 1984.)
Now remember: 2002 was an important year in the annals of welfare reform, as it was the fifth year following the original implementation of TANF. TANF was supposed to limit an individual’s eligibility for direct cash assistance to five years, but until last year, Rhode Island had been skirting this regulation by not counting time spent collecting aid through TANF-related programs in other states against eligibility in Rhode Island.
Putting this all together, what the Census Bureau data shows is that at the same time that some welfare recipients would be confronting the possiblity of losing their direct cash assistance because they had exceeded their eligibility time limits, there was a sustained increase in the number of poor people living in Rhode Island, where the TANF five-year time limit was being interpreted much more loosely than in the rest of the country.
Are those who believe in the importance of a robust and effective societal safety net willing to attribute this trend to pure coincidence, and not consider the possibility that Rhode Island may be in need of some long-term solutions for bringing its poverty rate down to more historically normal levels?
Continue reading "Is Rhode Island a Welfare Draw? Part 2: Some Statistics"
March 14, 2007
Is Rhode Island a Welfare Draw? Part 1: Some Background
A spate of recent op-eds and news stories have challenged the idea that Rhode Island’s welfare policies create incentives for people from other states to move to Rhode Island in search of public assistance. Brian C. Jones of the Providence Phoenix has claimed the idea of Rhode Island as a welfare magnet is as credible as the idea of Bigfoot. Angel Tavares wrote in a February 18 Projo op-ed that it is “common sense” that “high housing costs and lack of job opportunities…would dissuade poor people from finding our state attractive”. And in Sunday’s Projo, Scott Mayerowitz quoted Rhode Island College Poverty Institute Executive Director Kate Brewster as saying that it is “common sense” that Rhode Island’s housing costs would keep people from moving here.
Part of the argument against Rhode Island as welfare magnet is that no one piece of silver-bullet evidence exists proving that it is so. Mayerowitz’s article goes into some detail on this subject…
While arguments rage on both sides of the issue, there is very little information to prove or disprove that there is a large influx of the poor because of Rhode Island’s welfare programs....The only RI data source that officially tracks information on out-of-state origins of welfare recipients is a survey administered to public assistance applicants by the state’s Department of Human Services, but that survey only covers only one of the state’s major poverty programs…“While there is anecdotal evidence, there is no hard data,” acknowledges Carcieri’s spokesman, Jeff Neal.
Applicants are asked if they have lived out of state in the last 90 days and, if so, where. Gary Alexander, acting director of the state Department of Human Services, said he doesn’t have enough staff to verify whether the applicants are telling the truth. So Alexander said he is skeptical about the limited data collected. The state does not ask similar questions on applications for subsidized child-care or for RIte Care.Other critics of the survey's reliability have pointed out that there are incentives for applicants not to answer DHS questions honestly, as current eligibility rules require the rejection of applicants who have spent five years on public assistance in other states.
Jones and Tavares both go beyond the survey data, suggesting that a sustained reduction in the number of people receiving direct cash assistance from the government runs counter to the idea of an influx of assistance-seekers into Rhode Island. Can RI be considered a welfare magnet if the total number of people receiving welfare has dropped by about 50% in a ten year period?
However, the reduction in caseload is not unique to Rhode Island; it is a nationwide phenomena (Jones notes this; Tavares doesn't) resulting from the welfare reform policies enacted during the Clinton administration. In 1996, the last full year of the old Aid to Families with Dependent Children (AFDC) program, government was helping about 4,500,000 families by means of direct cash assistance. Today, the total number of families receiving direct cash assistance is down to 1,800,000, thanks to the reformed Temporary Assistance to Needy Families (TANF) program which began in 1997. (For those interested in the history and results of welfare reform, Kay Hymowitz has an excellent article on the subject in the Spring 2006 issue of City Journal).
But in Rhode Island, the reduction in direct cash assistance has not led to a reduction in total welfare spending. Monies no longer being spent on traditional welfare programs have been re-directed, almost dollar for dollar, into subsidized child-care. Rhode Island has gone from spending a combined $135 million in 1997 on cash assistance and child care (14% to child care) to spending $146 million on the combined programs today (54% to child care). [Source: page 18 of the Poverty Institute's Starting RIght Child Care Report from March 2006].
Yet, according to numbers reported by Mayerowitz, while the spending level has increased slightly, the number of recipients has decreased drastically…
Ten years ago, there were 61,770 people receiving cash assistance in Rhode Island. Today — after a series of changes in the program as part of the national welfare-reform movement — there are 33,000 Rhode Islanders receiving cash assistance.Add the numbers of cash-assistance plus child care recipients together, and you find that the number of recipients of aid has dropped from 67,836 in 1997 to just 45,704 recipients in 2006 -- all while the total cost of the programs has gone slightly up. The increase in spending is because the size of the child-care subsidy per recipient has doubled, from about $3,100 per recipient in 1997 to about $6,200 per recipient today.During that period, the welfare spending has shifted toward more subsidized child-care and health care. In fiscal year 1997, 6,066 people were on the state’s child-care rolls. Last year, that grew to 12,704. In that same period, spending on RIte Care nearly quadrupled.
This dynamic is a perfect illustration of why taxpayers are rightly skeptical of bureaucratic poverty programs. Protecting the size of budgets seems to be at least as important a goal as delivering effective aid. If, by some combination of luck, skill, and circumstance, Rhode Island was able to reduce the number of people needing child care and/or direct cash assistance to 30,000, would the state’s poverty advocates still insist that it is absolutely necessary to spend $150 million dollars on whomever is left?
Still, this is all an aside to the question we started with: Is there any evidence that people from other states are coming to Rhode Island specifically to collect public assistance. To try to answer that question, we have to see if there are any other data sources available...

 About Community Crier

 About Engaged Citizen