
 Click here for the new Anchor Rising & Ocean State Current page
June 7, 2012

Rhode Island's Decidedly Non-Austere State Budget History: (Third and Final Update)
As the state budget goes before the full Rhode Island House today, here are a few graphics showing how this year's spending fits into the longer-term pattern of Rhode Island state spending. This first graph shows a slight breather, in terms of current dollars, in the continuing growth in state budgets that has been occurring for over a decade. ("Current dollars" is the formal economics term for amounts spent at the time they were spent, e.g. when your grandparents you that the newspaper only used to cost a nickel, they are telling you what the price of a newspaper was in current dollars).
One point however, related to the recent news about layoffs at the Department of Labor and Training: If you examine the DLT budget, you will find its Federal funding dropping $112M between this fiscal year and next, from about $224M to $112M -- following a jump up from about $70M to $330M between fiscal years 2009 and 2010. So in terms of current dollars, all of the "austerity" in this year's budget could be accounted for by reductions in Federal dollars that were known to be temporary from the beginning.
Chart 1:
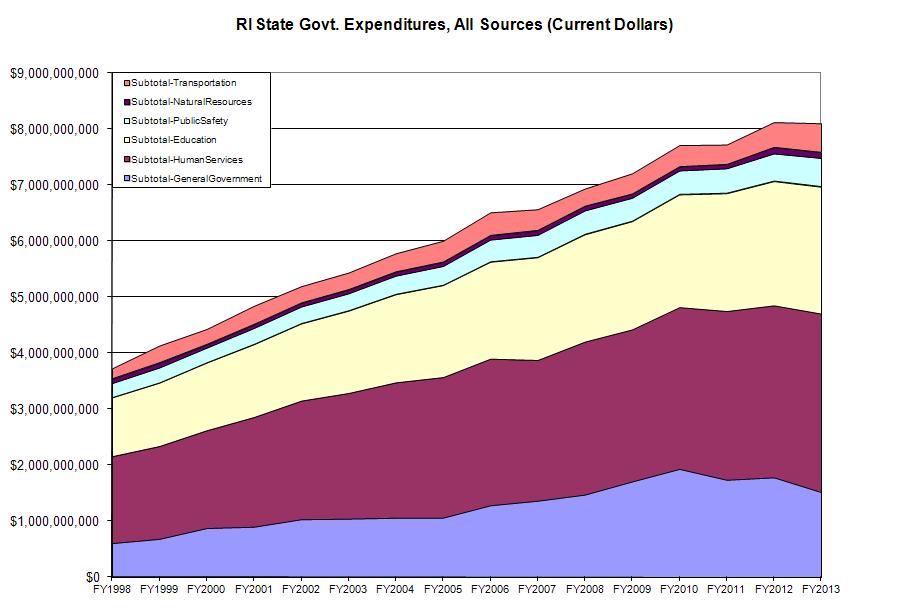
Chart 2:
Using inflation numbers published by the Department of Labor and Training, spending totals from the past can be expressed in terms of "2012 dollars" (I assumed 2% inflation between this year and next year, for which there is no definitive data available, since it hasn't happened yet). The inflation adjusted totals show the continuation of a pause in the growth of inflation adjusted spending that began in FY2011, if this budget is held to(*), which follows $2 billion in spending growth above the level of inflation that had occurred over the previous decade. Calling this year's budget an "austerity" budget assumes that automatic faster-than-inflation growth in government spending is the norm.
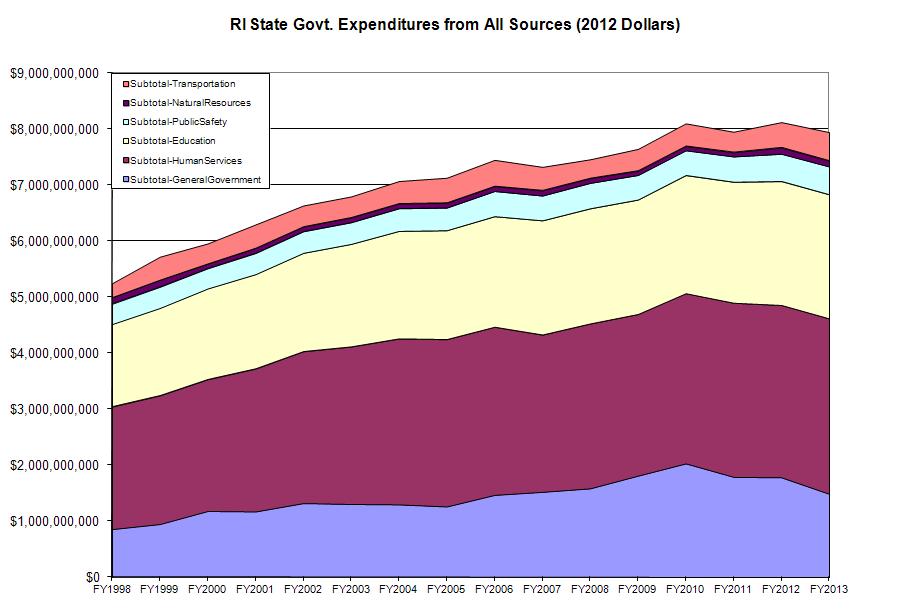
(*) The state actually overshot its originally passed FY2012 budget by about $400M, though a large portion of that came from Federal money, and none was attributed to the state's general revenues.
Chart 3:
The next graph shows the inflation adjusted Rhode Island government spending from general revenues (basically state taxes). The first budget approved during the Chafee administration grew spending by about 3%, adjusted for inflation, relative to the final budget approved during the Carcieri administration.
And if inflation over the next year is in the 2%-3% range, the growth of spending adjusted for inflation will also be in the 2%-3% range (or, more properly, in the 3%-2% range). In terms of current dollars, general revenue spending is budgeted to grow by about $150M next year, or 5% relative to this year, as part of the some-call-it-"austerity" plan.
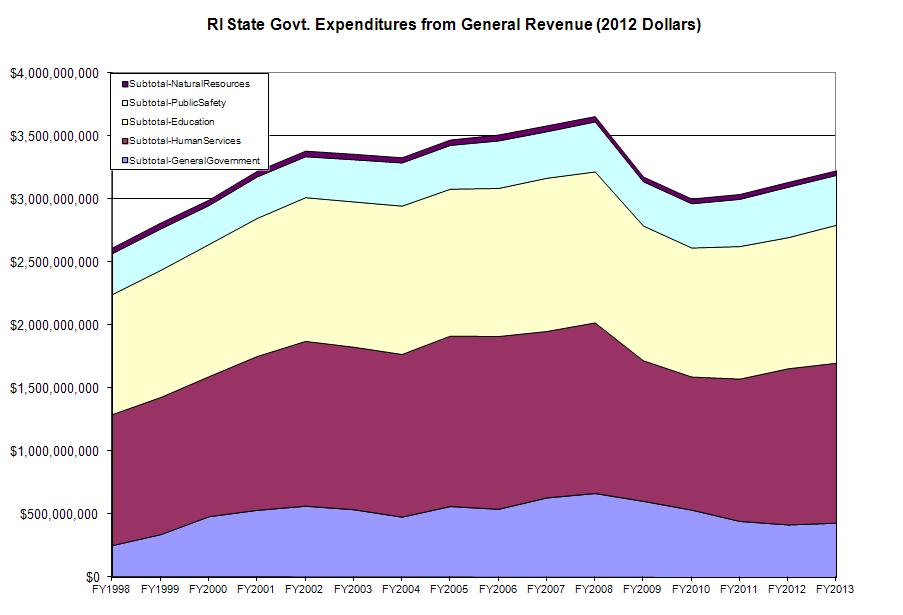
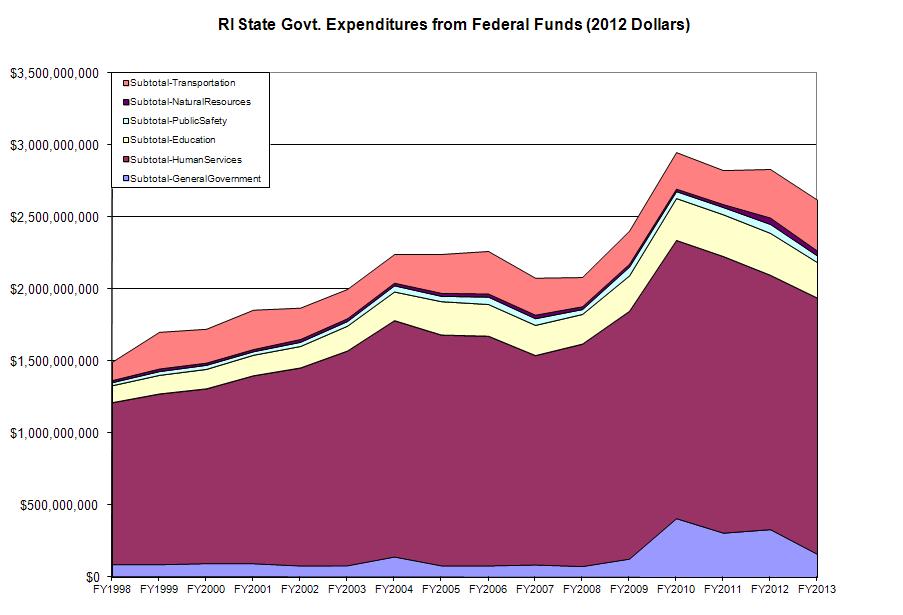
Chart 4:
The final chart presented in this post shows the Federal dollars included in the Rhode Island budget. Notable features on this chart are the spike resulting from the financial meltdown and associated stimulus, and a suggestion of what a future normal level of Federal spending might look like.
Figures compiled from data available from:
- The Rhode Island House of Representatives Fiscal Staff report on the FY2013 RI Budget.
- Previous year's gubernatorial budgets, archived by the RI Dept. of Administration's Budget Office.

 About Community Crier

 About Engaged Citizen
 Administrator