
January 26, 2011

2009 RI NAEP Science Data: Part 1 - 4th Grade Students
The ProJo reported on the results of the lates NAEP Science (for 2009) results for RI and it wasn't pretty. I went over to the NAEP website and dug deeper into the data. What follows are some of the things I found related to the 4th grade results (all I've got time for, I hope to get to the 8th grade later on). So.....CHARTS!
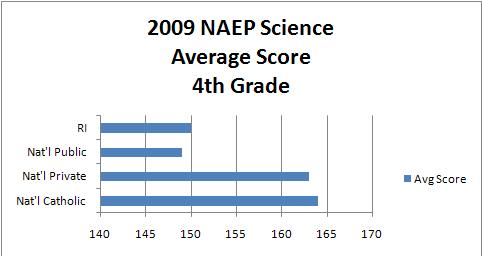
I used the average scores as the main data point for comparison. First, here are the overall average scores for Rhode Island (ranked 26th), the nation and includes a breakout of public/private differences. Also indicated are the national scores for Catholic schools, which, this being Rhode Island, I thought worthwhile to include (again, the average is national, not just for RI). Finally, there were 47 "units" measured, which were 46 states and Dep't of Defense schools.
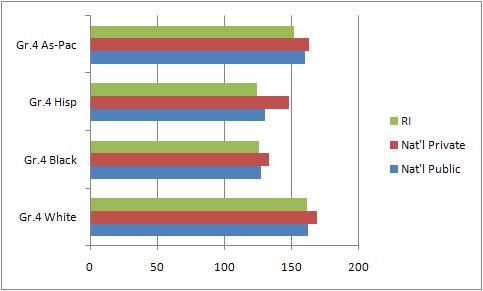
Next is the racial breakdown. RI's white students ranked 28th; blacks were 26th (out of 40 units--some states didn't have enough for a sufficient sample); Hispanics were 42nd (out of 44--ahead of only AZ and CA) and Asian/Pacific kids were 27th (out of 31).
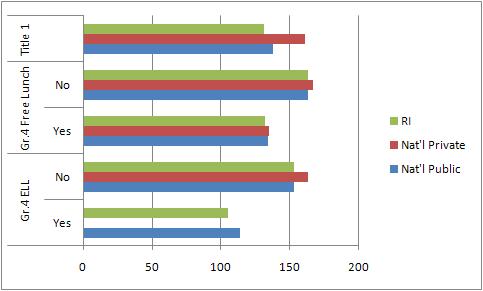
Then there are other demographic breakdowns, such as English-Language Learners (ELL) , School Lunch program participants and those at Title 1 designated schools (nearly 50% of RI schools are so designated). For ELL students, RI ranked 34th out of 38th for schools with ELLs and 27th out of 47th in schools without ELLs. RI School lunch participant scores averaged 35th out of 46 and those who didn't ranked 23rd. Those attending Title 1 schools in RI ranked 42nd out of 47.
All in all, the data contains few surprises, unfortunately. Poor, non-English speaking minorities fare the worst in RI's education system. Yet those who don't fall into such underprivileged demographics aren't, on average, faring very well either. In fact, across the board, no matter the demographic, RI students are doing no better than average as compared to national public school students of similar identification.
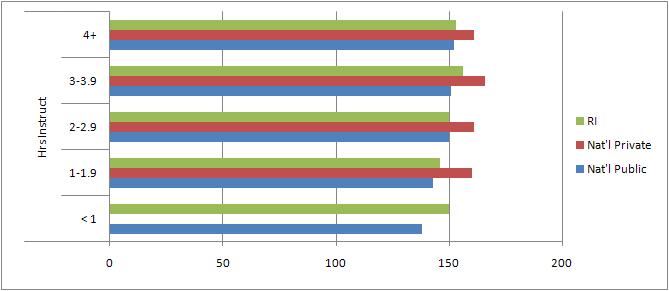
There is also data related to instruction time and the type of teacher giving the instruction. For instance, here are results charted against average instruction times. They seem to indicated that 3-4 hours of Science instruction per week is the sweet spot for 4th graders.
But what about scores as compared to those doing the teaching? That's up next.
"In fact, across the board, no matter the demographic, RI students are doing no better than average as compared to national public school students of similar identification."
But that's not completely true. Look at the very first chart. The average RI 4th grader is scoring 150. The national average 4th grader is scoring about 148. It's not a huge difference, but it is better than average.
Posted by: Patrick at January 26, 2011 4:24 PM