
 Click here for the new Anchor Rising & Ocean State Current page
March 1, 2010

The State of Education in Rhode Island, Part 3
An examination of the NECAP reading proficiency results presented in Part 2 reveals that only 2 of 12 Rhode Island school districts that began with 70% or more of their students proficient or better in the 8th grade according to the 2005/2006 NECAPs exhibited an increase in their total numbers of students proficient by the 11th-grade. (The two districts were Portsmouth-Little Compton and Smithfield).
This raises at least two questions almost immediately. First, once a district reaches 70% proficiency, is improving the performance of the 30% who remain below the proficiency line (while not losing any of 70% above the line) a more difficult and perhaps qualitatively different problem than educating the "first" 70%? Note, for example, the contrast with districts that began in the range of 50% to 60% proficient in 8th-grade; 10 out of the 13 of these districts were able to increase their total number of student proficient. Answering this question accurately will ultimately involve either a few more years of Rhode Island data, or data from other parts of the country.
There is a second question, however, that we can go after right away: is talking about "proficient or better" where a discussion about educational achievement should end? One criticism of No Child Left Behind Act and the testing regime it has engendered is that too much emphasis is placed on making students average, perhaps at the expense on helping students excel, i.e. if schools are being held accountable for their number of students who are proficient or better, how much effort will they expend on helping the students already proficient improve from there?
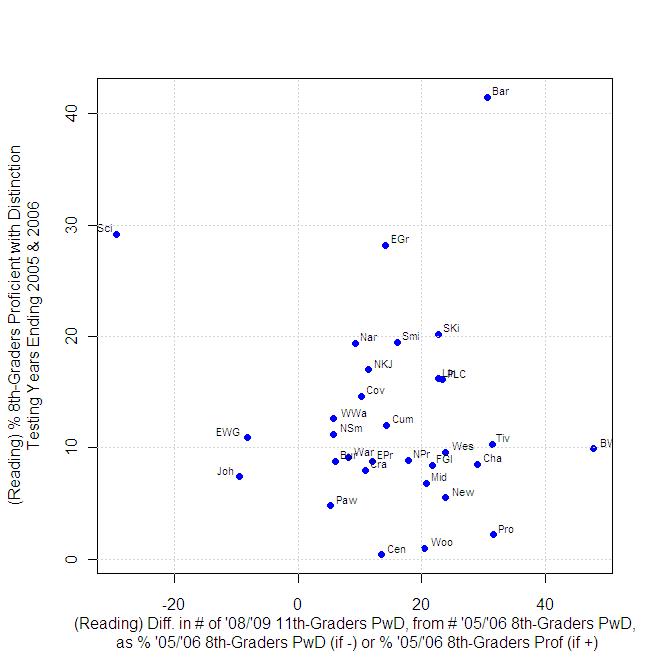
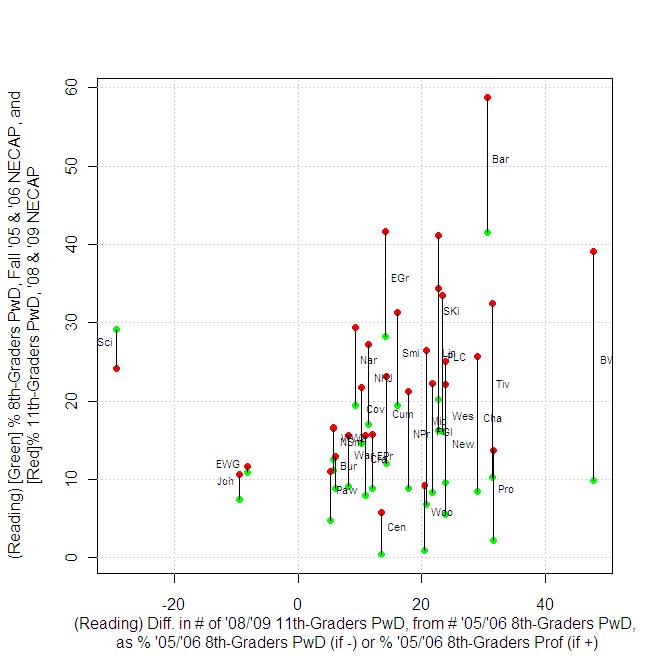
The structure of NECAP provides a way to look into this question. Instead of looking for proficiency-or-better, we can look at the number of students who scored "proficient with distinction" -- the highest score attainable on the NECAP. And, at least at a first glance, the PwD results in reading provide are some of the most encouraging for education in Rhode Island so far, where between the 8th and 11th-grade NECAPs, almost every district in Rhode Island saw an increase in the number of students who scored "proficient with distinction".
Proficient-with-distinction absolute numbers can be turned this into a percentage in the same way as the proficient-or-better numbers were, with the appropriate choice of denominator. One such choice is to use the number of students who were "proficient" in the 8th grade in each district, in cases where districts increased their number of PwD students. One way to interpret this result is as a measure of how well school districts are doing with the group of students that have shown a a level of commitment to academics.
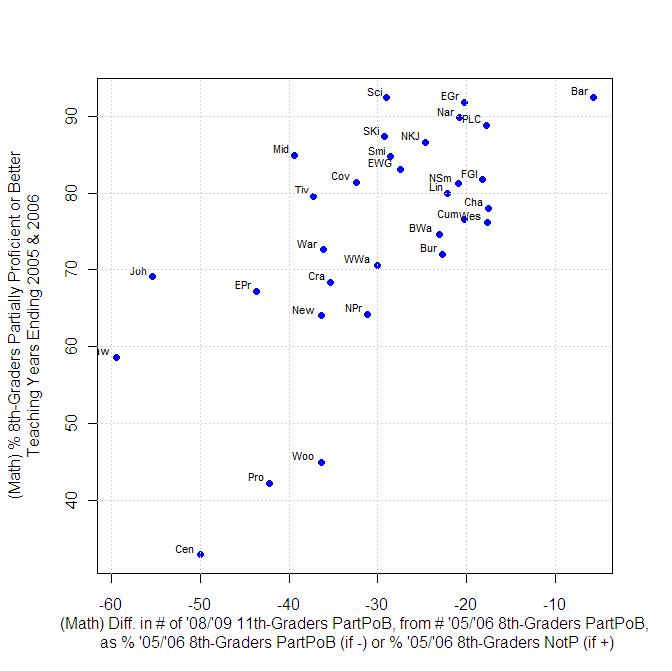
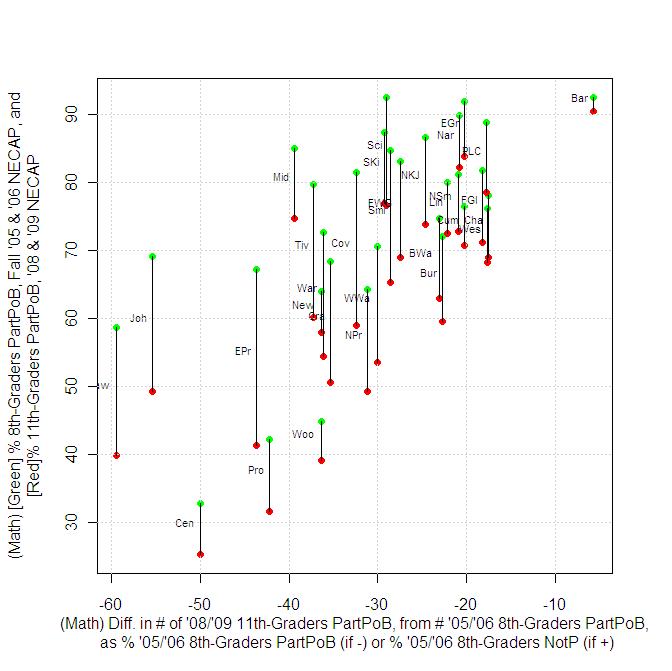
In mathematics, the basic problem is the opposite from the one of reading; given that every RI district underwent a loss of proficient-or-better students between 8th and 11th-grade results, maybe if the numbers of partially-proficient of better students are analyzed, we will be able to observe a stoppage of the bleeding.
Alas, the result is not any more heartening than the proficient or better is Rhode Island. Every district in Rhode Island saw a decline in the number of students who were partially proficient or better, and there is no avoiding the fact that mathematics education everywhere in Rhode Island is in a state of complete collapse.
| Community | # of 11th-Graders, PwD at Reading, '08 and '09 NECAP | # of 8th-Graders, PwD at Reading, '05 and '06 NECAP | Change in # PwD at Reading, between 8th and 11th Grades | # of 8th-Graders, Prof. at Reading, '05 and '06 NECAP | Change in # PwD at Reading, between 8th and 11th Grades, as % of '05/'06 8th-Graders Prof. |
| Bristol-Warren | 192 | 53 | 139 | 291 | 47.8% |
| Providence | 410 | 85 | 325 | 1030 | 31.6% |
| Tiverton | 97 | 37 | 60 | 191 | 31.4% |
| Barrington | 326 | 238 | 88 | 288 | 30.6% |
| Chariho | 147 | 52 | 95 | 327 | 29.1% |
| Newport | 60 | 21 | 39 | 163 | 23.9% |
| Westerly | 125 | 52 | 73 | 306 | 23.9% |
| Portsmouth-Little Compton | 159 | 82 | 77 | 330 | 23.3% |
| Lincoln | 158 | 87 | 71 | 313 | 22.7% |
| South Kingstown | 221 | 134 | 87 | 384 | 22.7% |
| Foster-Glocester | 90 | 36 | 54 | 249 | 21.7% |
| Middletown | 71 | 26 | 45 | 216 | 20.8% |
| Woonsocket | 68 | 10 | 58 | 283 | 20.5% |
| North Providence | 112 | 52 | 60 | 338 | 17.8% |
| Smithfield | 123 | 83 | 40 | 249 | 16.1% |
| Cumberland | 167 | 100 | 67 | 468 | 14.3% |
| East Greenwich | 151 | 117 | 34 | 240 | 14.2% |
| Central Falls | 22 | 2 | 20 | 148 | 13.5% |
| East Providence | 139 | 85 | 54 | 447 | 12.1% |
| North Kingstown-Jamestown | 213 | 151 | 62 | 546 | 11.4% |
| Cranston | 246 | 143 | 103 | 947 | 10.9% |
| Coventry | 183 | 131 | 52 | 510 | 10.2% |
| Narragansett | 63 | 48 | 15 | 162 | 9.3% |
| Warwick | 244 | 167 | 77 | 952 | 8.1% |
| Burillville | 55 | 40 | 15 | 247 | 6.1% |
| North Smithfield | 46 | 35 | 11 | 189 | 5.8% |
| West Warwick | 90 | 75 | 15 | 264 | 5.7% |
| Pawtucket | 104 | 74 | 30 | 581 | 5.2% |
| Community | # of 11th-Graders, PwD at Reading, '08 and '09 NECAP | # of 8th-Graders, PwD at Reading, '05 and '06 NECAP | Change in # PwD at Reading, between 8th and 11th Grades | # of 8th-Graders, Prof. at Reading, '05 and '06 NECAP | Change in # PwD at Reading, between 8th and 11th Grades, as % of '05/'06 8th-Graders PwD |
| Exeter-West Greenwich | 34 | 37 | -3 | 204 | -8.1% |
| Johnston | 38 | 42 | -4 | 299 | -9.5% |
| Scituate | 65 | 92 | -27 | 170 | -29.3% |
| Community | # of 11th-Graders, PartPoB at Math, '08 and '09 NECAP | # of 8th-Graders, PartPoB at Math, '05 and '06 NECAP | Change in # PartPoB at Math, between 8th and 11th Grades | Change in # PartPoB at Math, between 8th and 11th Grades, as % of '05/'06 8th-Graders PartPoB |
| Barrington | 500 | 530 | -30 | -5.7% |
| Chariho | 396 | 480 | -84 | -17.5% |
| Westerly | 341 | 414 | -73 | -17.6% |
| Portsmouth-Little Compton | 373 | 453 | -80 | -17.7% |
| Foster-Glocester | 288 | 352 | -64 | -18.2% |
| East Greenwich | 304 | 381 | -77 | -20.2% |
| Cumberland | 509 | 638 | -129 | -20.2% |
| Narragansett | 175 | 221 | -46 | -20.8% |
| North Smithfield | 201 | 254 | -53 | -20.9% |
| Lincoln | 334 | 429 | -95 | -22.1% |
| Burillville | 252 | 326 | -74 | -22.7% |
| Bristol-Warren | 307 | 399 | -92 | -23.1% |
| North Kingstown-Jamestown | 579 | 768 | -189 | -24.6% |
| Exeter-West Greenwich | 203 | 280 | -77 | -27.5% |
| Smithfield | 257 | 360 | -103 | -28.6% |
| Scituate | 206 | 290 | -84 | -29.0% |
| South Kingstown | 410 | 580 | -170 | -29.3% |
| West Warwick | 292 | 417 | -125 | -30.0% |
| North Providence | 260 | 378 | -118 | -31.2% |
| Coventry | 494 | 731 | -237 | -32.4% |
| Cranston | 796 | 1230 | -434 | -35.3% |
| Warwick | 846 | 1324 | -478 | -36.1% |
| Newport | 156 | 245 | -89 | -36.3% |
| Woonsocket | 286 | 450 | -164 | -36.4% |
| Tiverton | 179 | 285 | -106 | -37.2% |
| Middletown | 198 | 327 | -129 | -39.4% |
| Providence | 946 | 1638 | -692 | -42.2% |
| East Providence | 367 | 652 | -285 | -43.7% |
| Central Falls | 95 | 190 | -95 | -50.0% |
| Johnston | 176 | 395 | -219 | -55.4% |
| Pawtucket | 375 | 924 | -549 | -59.4% |

 About Community Crier

 About Engaged Citizen
 Administrator