
 Click here for the new Anchor Rising & Ocean State Current page
February 22, 2010

The State of Education in Rhode Island, Part 1
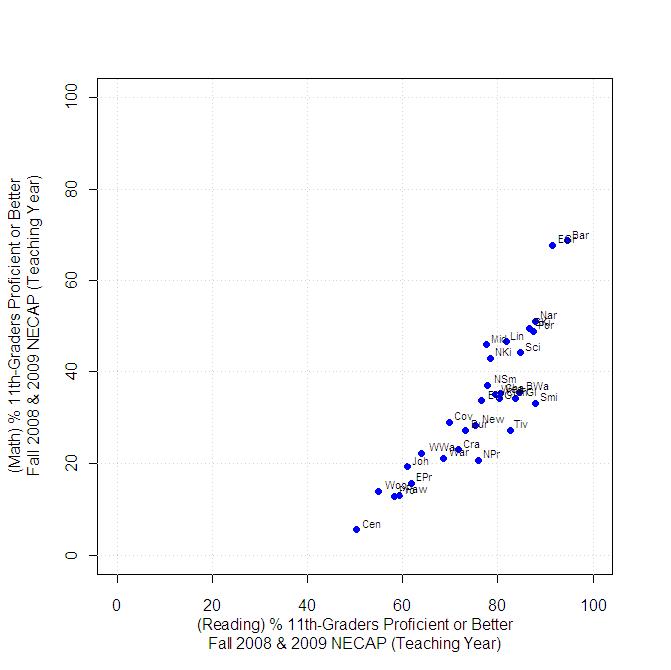
The graph at the bottom of this post, compiled from the two most recent years of New England Common Assessment Program (NECAP) proficiency scores, contains the information you are probably used to seeing for describing the state of education in the cities and towns of Rhode Island. And if you are familiar with the data displayed there, then you are probably also familiar with the oft-expressed objection to its use for school-system accountability purposes, that the graph is mostly an illustration of the social-economic status of the various communities represented, more than of how well a school-system is doing or not doing with the students it has.
However, if instead of confining the analysis of test results to scores taken from one point in time, consideration is given to changes in scores in a group of students across time, then it becomes possible to begin to isolate the factors that impact test scores which are directly related to the school-system, for example, through an examination of the evolution of performance of similar student cohorts who start from comparable achievement levels. This idea is the basis of what is called the "value-added" method of analysis of education. Since much of the focus has been on high schools lately, let's see what can be done with Rhode Island's basic 11th-grade NECAP results, to take a step in this direction.
Rhode Island 11th-graders have been tested in the subjects of reading and math with the NECAP for the past two years. 3 years prior to those tests, many of those same 11th-graders took the NECAP as 8th-graders, and changes in performance at the school and district level, between grades 8 and 11, involving many of the same students, can be evaluated.
But exactly what changes should be measured? NECAP results characterize student achievement in terms of four categories, the numbers of students "proficient with distinction", "proficient", "partially proficient", and "not proficient". The summary that is most frequently reported to the public is the percentage of students in a district (or school) who are proficient or better. However, a comparison of proficiency percentages from year to year may not fully capture what is going on inside of a school. Between 8th and 11th grade, almost every district loses students. In some districts, according to the NECAP totals, that figure can be as high as 30% and the reasons for enrollment drops (e.g. dropouts, students leaving for private schools or charters, etc.) will skew percentage measures in ways that don't necessarily reflect the quality of schooling.
So instead of going directly to results expressed as percentages, we will begin by taking a step back and looking at how the number of students proficient or better in 11th grade in each district changed from the number of students who were proficient in 8th grade in that same district. We can combine the two approximate cohorts of students for which 11th grade test data is available, and calculate the how the number of 11th grade students who scored proficient or better on the 2008 and 2009 NECAPs in each district changed from the number of 8th grade students who scored proficient or better on the 2005 and 2006 NECAPs
Several results become immediately obvious:
- Even in many of the districts thought of as poorly performing, the number of students proficient or better in reading improved between the 8th and the 11th grade testing (even when total enrollments dropped).
- In every school district in Rhode Island -- including the ones thought of as well-performing -- the number of students who are proficient or better at mathematics in the 11th grade is less than the number of students who were proficient or better in the 8th grade.
| District | # of 8th-Graders Proficient or Better at Reading, '05 & '06 NECAP | # of 11th-Graders Proficient or Better at Reading, '08 & '09 NECAP | Change in # PoB at Reading, between 8th and 11th Grades | # of 8th-Graders Proficient or Better at Mathematics, '05 & '06 NECAP | # of 11th-Graders Proficient or Better at Mathematics, '08 & '09 NECAP | Change in # PoB at Mathematics, between 8th and 11th Grades |
| Barrington | 526 | 524 | -2 | 485 | 380 | -105 |
| Bristol-Warren | 344 | 415 | 71 | 293 | 173 | -120 |
| Burrillville | 287 | 310 | 23 | 213 | 115 | -98 |
| Central Falls | 150 | 190 | 40 | 85 | 21 | -64 |
| Chariho | 379 | 461 | 82 | 347 | 202 | -145 |
| Coventry | 641 | 586 | -55 | 569 | 243 | -326 |
| Cranston | 1090 | 1132 | 42 | 779 | 361 | -418 |
| Cumberland | 568 | 579 | 11 | 433 | 247 | -186 |
| East Greenwich | 357 | 332 | -25 | 341 | 246 | -95 |
| East Providence | 532 | 549 | 17 | 437 | 140 | -297 |
| Exeter-West Greenwich | 241 | 224 | -17 | 219 | 99 | -120 |
| Foster-Glocester | 285 | 339 | 54 | 270 | 139 | -131 |
| Johnston | 341 | 220 | -121 | 226 | 69 | -157 |
| Lincoln | 400 | 375 | -25 | 344 | 215 | -129 |
| Middletown | 242 | 208 | -34 | 264 | 122 | -142 |
| Narragansett | 210 | 188 | -22 | 176 | 109 | -67 |
| Newport | 184 | 204 | 20 | 174 | 76 | -98 |
| North Kingstown -Jamestown | 697 | 615 | -82 | 602 | 337 | -265 |
| North Providence | 390 | 401 | 11 | 237 | 110 | -127 |
| North Smithfield | 224 | 215 | -9 | 198 | 102 | -96 |
| Pawtucket | 655 | 561 | -94 | 552 | 123 | -429 |
| Portsmouth-Little Compton | 412 | 415 | 3 | 381 | 233 | -238 |
| Providence | 1115 | 1749 | 634 | 873 | 385 | -488 |
| Scituate | 262 | 228 | -34 | 240 | 119 | -121 |
| Smithfield | 332 | 345 | 13 | 255 | 131 | -124 |
| South Kingstown | 518 | 466 | -52 | 476 | 265 | -211 |
| Tiverton | 228 | 247 | 19 | 215 | 81 | -134 |
| Warwick | 1119 | 1069 | -50 | 923 | 330 | -593 |
| Westerly | 358 | 396 | 38 | 296 | 175 | -121 |
| West Warwick | 339 | 350 | 11 | 300 | 122 | -178 |
| Woonsocket | 293 | 405 | 112 | 241 | 102 | -139 |
(N.B.: Results for North Kingstown and Portsmouth have been corrected from the original version of this post, to properly account for the fact that high-schools in these districts serve students from Jamestown and Little Compton, respectively.)
Next, we need to find an appropriate context with which to evaluate the absolute count data. That will be the subject of tomorrow's post on the subject…

 About Community Crier

 About Engaged Citizen
 Administrator


These numbers seem to indicate that many HS English departments are doing a pretty good job. It also means that if you want to fire just some of the teachers, start with the Math department.
I think part of this is also just society. It's easy to read, and if you don't understand some words, look 'em up. You can read about any topic that interests you. Reading is extremely varied in topics It's not quite so easy for someone to just pick up a trigonometry or calculus problem and "work it out". You can always ask mom what a word means and maybe she knows, but ask parents to help find a derivative? No chance.
This might actually be a great area for someone to pick up the torch and place emphasis on the area of math in schools.
It is pretty amazing that not one school district did improve their math results.
Posted by: Patrick at February 22, 2010 1:25 PMLooks like we should not fire all the teachers in Central Falls, but maybe start with all the teachers in Barrington and other communities where all the scores when down.
Posted by: Tara at February 23, 2010 10:12 AMTara, I'm pretty sure that your post is tongue-in-cheek, but that was explained. When they go up, the increase is definite, because this just measures raw numbers, not percentage, and every district decreases the number of students between 8th and 11th grade. But when they go down, that might not be real, as least with regard to the Reading score. They only went down by 2 students, and quite possibly they lost more than that from the system, so maybe they actually went up, as a percentage. Math though, I doubt the school system lost more than 105 students, so that is a true down, but is it any worse than other districts? We can't really tell with the numbers here.
Posted by: Patrick at February 23, 2010 10:44 AMTara,
You need to wait until part 3, before making a final call on Barrington.
Patrick,
Your comment about picking up the torch reminded me that, for a couple of years in the recent past, Rhode Island's progressives annually advocated cuts to the Governor's science, technology and mathematics initiatives, as a way of balancing the budget. Ain't this state just grand!
Posted by: Andrew at February 23, 2010 8:14 PMRhode Island's progressives annually advocated cuts to the Governor's science, technology and mathematics initiatives, as a way of balancing the budget.
I am guessing that while the advoacted for those cuts they also advocated for increases in Special Ed funding.
I am new to all this education data, but as someone familiar with looking at graphs, the one thing that sruck me when I looked at my District's NECAP scores was that we are doing something on a systemic basis that is resulting in our kids congregating in the lower achievement catagories. Could it be that while try to leave no child behind we don't push those who can to excel? The distribution of the test results just are not a normal distribution in most cases.
Posted by: gina at February 24, 2010 9:27 AM