
August 10, 2009

Taxes, Wealth, and Recovery
With the reminder that Rhode Island is at the top of the list when it comes to stimulus spending per capita, I thought of a table that I'd seen predicting the years during which each state's economy would recover to pre-recession employment levels. Curious what it would look like, I added the recovery information to the table that I used while assessing whether there might be a correlation between tax burden and the proportion of wealthy residents.
The result is below. The colors still correspond with tax burden (red being the highest), and the middle column still ranks states according to the number of IRS tax returns showing income over $200,000 (highest at the top). The patterns in the new column are meant to group the states by the year in which they'll recover, with those at the top matching previous employment levels by 2011 and those at the bottom doing the same some time after 2015.
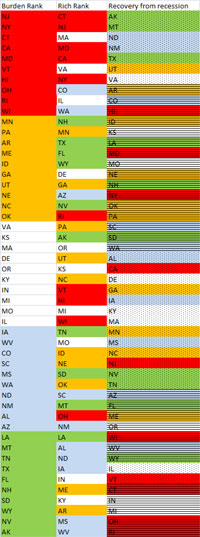
Nothing decisive, but interesting.