
 Click here for the new Anchor Rising & Ocean State Current page
January 7, 2009

Night Is Still Night
Pat Crowley's been working diligently to prove that, when it comes to taxation in Rhode Island, night is day. Yesterday, he stated his starting point thus:
Maybe, just maybe, we are loosing population because we have a cash and carry tax structure that benefits the elite at the expense of the poor, not the other way around as Eddie wants us to believe.
That's kinda tough to square with the fact, gleaned from the RI House's Revenues Facts document (PDF), that the tax share of the lowest group (income under $30,000) decreased from 3.8% to 1.3% from tax year 2005 to tax year 2006, while the tax share of the highest group (income over $200,000) increased from 40.3% to 44.0% over the same period. Crowley notes part of the reason for the shift on the low end:
According to real numbers supplied by the State revenue department, the between 2005 and 2006, the latest number available, the only group to lose population was people earning less than $30,000 a year:
- Under 30k – (2356)
- 30k – 50k – 387
- 50k-75k – 157
- 75k-100k – 1700
- 100k – 200k – 4666
- 200k+ - 987
Of course, it's important to correct impressions by highlighting the fact that these numbers reflect state tax returns, not "population," so a decrease in the lowest group is just as apt to reflect a decrease in the number of households required to file returns as an increase in out-migration. That's especially true during a tax year that saw a 6,976 increase in the number of federal returns showing income under $50,000.
Crowley recently used this state return data to suggest that "before anyone goes crazy thinking our tax structure is what is driving folks out, based on the numbers, not just projections, folks, or at least tax payers, are moving in." IRS migration data, however, tracking taxpayers by Social Security Number, finds definitively a net 3,733 having left the state between filing their '05 to '06 taxes.
To play along, though, if we analyze RI tax returns as closely to adult people as possible (i.e., double-counting joint returns), we find the following:
- Under 30k – (4160)
- 30k – 50k – (1402)
- 50k-75k – (2313)
- 75k-100k – 2052
- 100k – 200k – 8502
- 200k+ - 1860
As I keep saying, the people who are actually leaving are from the upper-working to lower-middle classes. But let's stick with Crowley's collection of claims as he attempts to extrapolate a more specific lesson:
In 2006 there were 491,750 tax returns filed, an increase of 5,541 over the previous year. And even though our collective taxable income rose by $1,044,615,287, we collected $80,281,003 less in income taxes. More filers, more taxable income, less revenue? How is that possible? Well, maybe because of how we structured our taxes?
Neglecting to consider the decrease in low-end tax returns that he mentions elsewhere, Crowley proceeds to shuffle around some numbers that really don't address his own question: How is it possible to gain returns, showing an increase in taxable income, but still collect less in taxes? Well, the answer emerges if we observe that overall tax liability actually increased by $59,667,202. What accounts for the difference is tax credits, which benefited every income category, with increases across the board, growing from $23,255,997 to $163,204,202 from 2005 to 2006. (Albeit, the increases were less in the middle range of income groups.)
Now check this out:
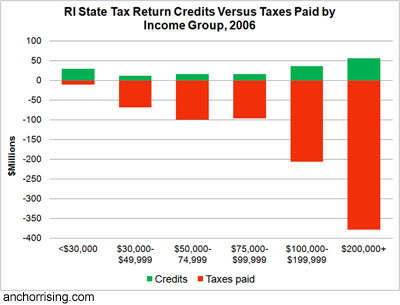
One can say a lot of things about RI's tax structure. Probably not among them is the assertion that taxes are driving out people whose income group receives significantly more in tax credits than it pays pack to the state.

 About Community Crier

 About Engaged Citizen


Great analysis, Justin.
"folks, or at least tax payers, are moving in."
"IRS migration data, however, tracking taxpayers by Social Security Number, finds definitively a net 3,733 having left the state between filing their '05 to '06 taxes."
Oops. Change that positive sign to a negative sign.
Posted by: Monique at January 7, 2009 9:23 PM