
August 30, 2008

Accepting the Dare to Compare SATs Across States
So a number of folks opined that the list of SAT scores for all fifty states that I posted the other day is meaningless because the states vary with respect to participation rates (PDF). Many states' students don't even take the SATs unless they want to go to certain higher-end universities on the East Coast, so of course they'd be apt to score better. By contrast, some have hypothesized that states with high participation rates may be encouraging students who mightn't otherwise bother to take the test, which would seem likely to drag scores down.
Cross-referencing the participation rates with the states' average scores leaves little doubt about the former point; the highest-scoring states have only single-digit percentages of students actually taking the test. But what about the latter point? Does high participation correlate with lower scores? Well, not really (solid lines follow the left axis; dotted lines follow the right):
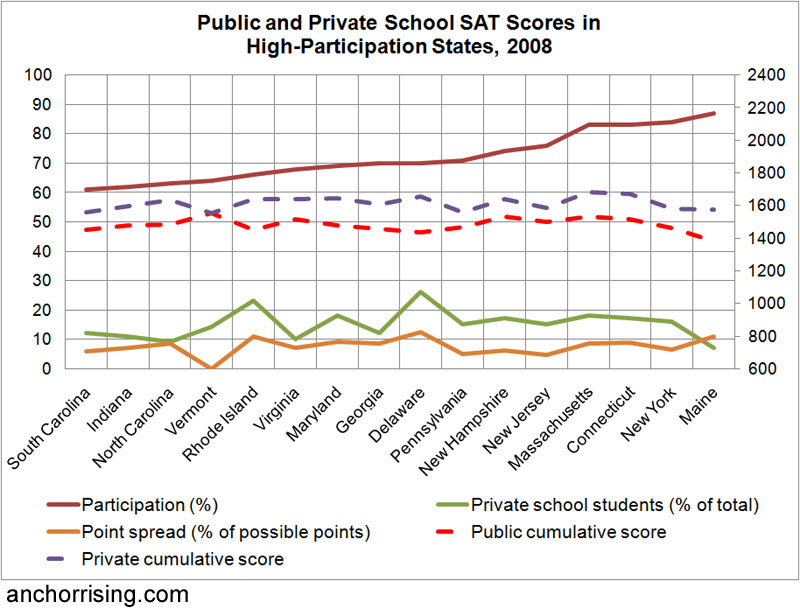
This chart includes the sixteen states in which more than 60% of graduating high school students take the SATs. Except for highlighting the fact that Rhode Island is on the wrong side of the chart to have such a low score, arranging the data this way doesn't appear to tell us much. Participation doesn't appear to correlate with SAT scores.
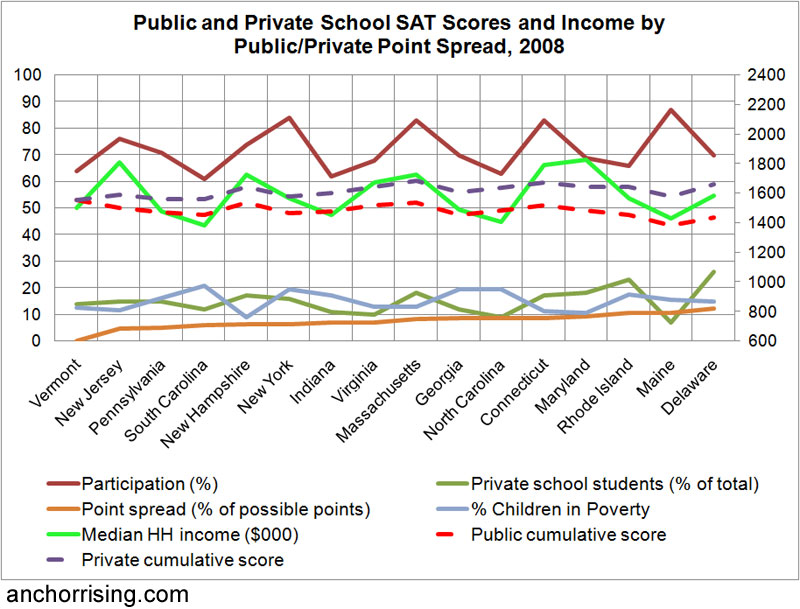
To see where Rhode Island stands by a different measure, I sorted the states by the point spread between public and private students, and beyond finding Rhode Island to be third worst, an interesting consequence of this arrangement emerges:
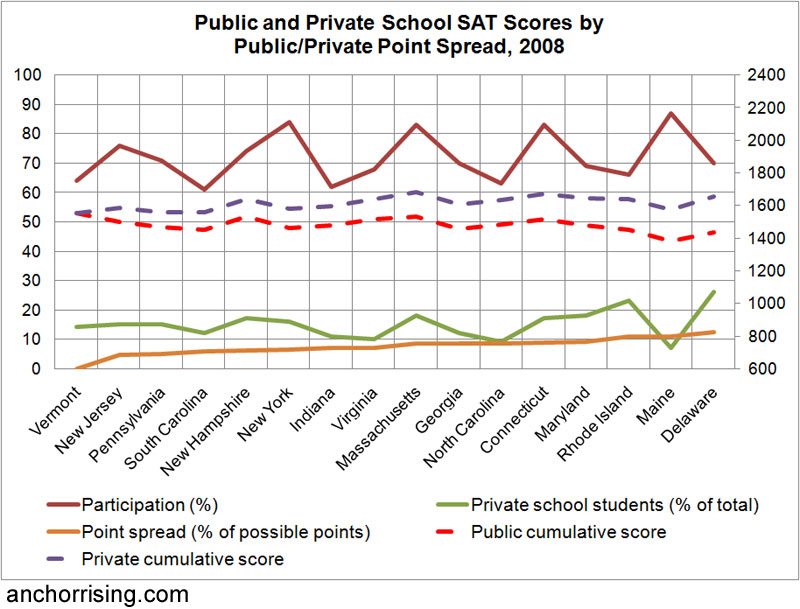
What's interesting is that, although the scores drift apart as we move to the right of the chart, public and private school grades fluctuate in similar ways. The implication is that something irrespective of the school is playing a role, and figuring it out might salvage some utility from this line of inquiry.
So, let's test the already-suggested child poverty explanation (data from 2007):
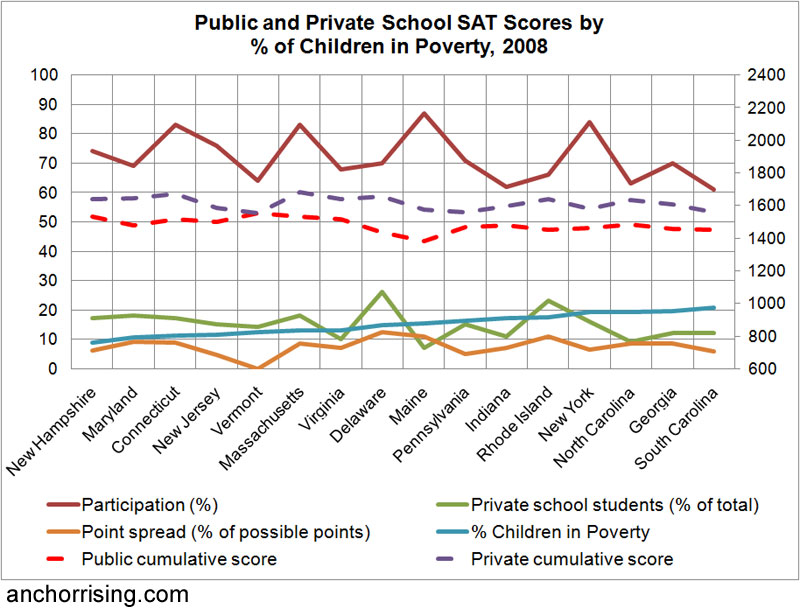
Although there does appear to be a downward drift of SAT scores as child poverty increases, it doesn't appear to be a strong correlation. Note, especially, that, although Rhode Island is still near the bottom of the list, those states beneath us are entirely different from those beneath us on the point spread chart.
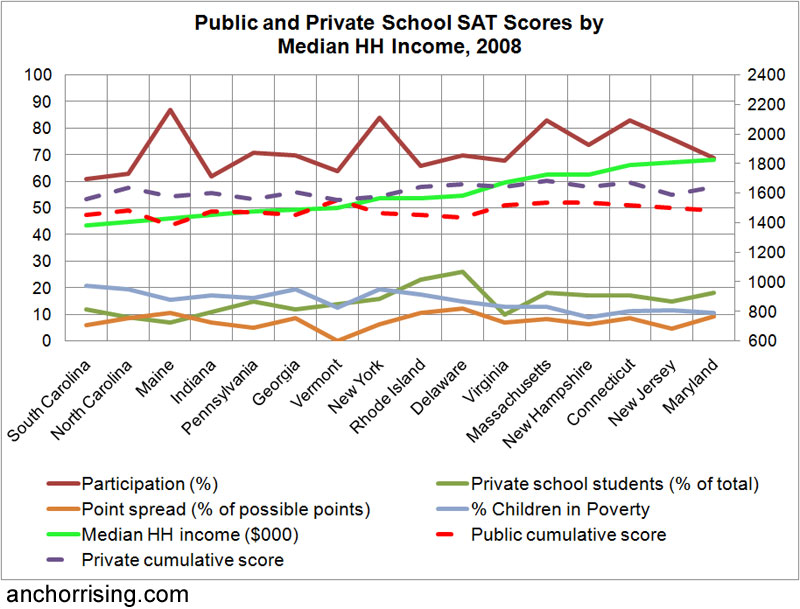
What if we switch to household income (data from 2007)?
Here, there doesn't even appear to be a drift, and certainly no correlation. Look, however, at what happens if we re-sort by point spread:
It appears that median income helps to explain the fluctuations, but neither income nor child poverty tell us much about the increasing disparity between public and private schools. Unfortunately, I've been unable to devise a method of quantifying the strength and zealotry of teachers' unions in each state, but it does not appear that public school teacher salary has much of an effect:

Of course, to some degree, income, private school attendance, public school teacher pay, and SAT scores all correlate, but Rhode Island stands out, in this regard: We've got an average median income, but the fifth highest public school teacher pay, the second highest private school student percentage, and the third lowest public school cumulative SAT score (despite the sixth highest private school cumulative SAT score). Take especial note of the coexistence of average wealth and high private school attendance.
We're certainly in the realm of speculation, here, but my hypothesis stands (and is, I chance to say, slightly stronger for this analysis): In Rhode Island, at least, the crushingly strong teachers' unions are draining the attractive qualities from the public schools, driving those families who can somehow manage to afford it — and who feel their children possess the potential to justify it — into the arms of the private schools.
Justin,
The people, College Board, who created the SAT has at the very start of the “2008 College-Bound Senior Total Group Profile Report” and on each state report under the heading “Using This Report” published the following statement:
“not all students in a high school, school district, or state take the SAT Reasoning Test. Since the population of test-takers is self-selected, using aggregate SAT Reasoning
Test scores to compare or evaluate teachers, schools, districts, states, or other educational units is not valid, and the College Board strongly discourages such uses.”
I would imagine that the people who created the SAT, collected the test data and created the report fully understand reasoning and published the above statement on all of the SAT reports and they are the very source you are using that indicated would be not valid if used in this manner.
Well, see, there are these tests that provide scores that measure something, and they are somewhat related to students' progression toward and acceptance to college. That they "self select" doesn't phase me, much, because after all, citizens "self select" for a lot of things that we analyze statistically across states: from marriage, to private school, to drug use, to television viewing.
On the other hand, there is this company that produces these tests, and it has been under fire from the self-esteem movement for decades, and yet it has a testing regime that it wishes to sell to schools and their students. Inasmuch as the relevant educational systems have seemed resistant to any measurement by which they might be compared, it's little wonder that the company would discourage the tests' use for that purpose.
I'm not saying that I'm headed to the General Assembly at first opportunity to offer policy proposals based solely on these findings, but the numbers as they exist have interesting consequences, and I think they're worth discussing. If you disagree, then don't.
Posted by: Justin Katz at August 31, 2008 6:47 AMHere's the bottom line:
The NEA/AFT/Educrat apologists in Rhode Island reflexively tell us how this, that or the other measure is flawed or doesn't present the true measure.
But they never provide any studies, information or data (from credible, objective sources) supporting their assertions that they're doing a good job (much less a superb job, or one commensurate with the well above average financial "investment" that Rhode Islanders make in the public education system).
If they could produce such supportive / validating information, for sure they'd trot it out both in defense and to buttress their arguments for "increased investment in education."
So that fact that they don't tells us that they can't, and confirms that public education in Rhode Island is (at best) mediocre in comparison to U.S. averages, which in turn is mediocre (at best) compared to those of other nations.
Posted by: Tom W at August 31, 2008 10:29 AMI don't think we need more evidence that RI's schools are worse than average. The NEA might disagree, but every objective national study that I've ever seen has confirmed it.
Bob Walsh is the equivalent of "Baghdad Bob": No, there are no tanks in Baghdad. Noise, what noise? I don't hear a noise."
The bigger problem is that the bright and talented students leave RI because there is no opportunity.
Posted by: Anthony at August 31, 2008 11:10 AMJustin,
I might have more to say about the analysis in the main post, which is rather interesting, but I have to respond to your comment.
You are right that self-selection (and other kinds of selection) take place in many sample in areas where we want to measure things. Sometimes, it doesn't matter because it doesn't bias the sample. In the ETS data, there is clearly such a bias, which I think is universally recognized by everyone who researches in this area.
There are several ways to control for this bias. Some statistical models explicitly model the bias to control for it. I have run some of these models in my own work. It might also be possible to control for it by narrowing the range of cases, as you have done. Whether or not that works depends on what you're trying to say.
However, it is simply not credible to suggest that this is not a real, and serious, statistical problem, with potential for leading to seriously incorrect results. I find it incredible that you suggest that ETS is only warning against cross-state comparisons in order to protect educational systems from accountability. Nobody who does stats will accept that.
I also think that your suggestion that addressing the problem is not itself part of the discussion is puzzling. It sounds as though you're saying, "if you don't like my methods, butt out".
Tom W. suggests that anybody who takes ETS's warning seriously is an apologist for AFT/NEA and has a duty to prove the RI schools are better than average. That's absurd on its face.
Posted by: Thomas Schmeling at August 31, 2008 3:36 PMNo, Thomas S, what we are saying is: present a case, based upon some form of reasonable evidence, that Rhode Island schools are performing any better than all of the studies and analyses over the last ten years unanimously suggest.
Posted by: Monique at August 31, 2008 4:26 PMMonique,
Why in the world should I feel a responsibility to do this?
First, the studies do not unanimously say the same thing. Justin's post that kicked all of this off placed RI at #47, with the implication that that had clear implications for the quality of RI schools. Do you think that's right? Do you think the methods that produced that conclusion are correct. If it's not right, tell me where should RI be placed, and by what methods do you reach that conclusion? Then we'll talk.
Second, you seem to have a mistaken impression of what I am about. I am not hear to defend any position about the quality of RI schools. I am here to FIND OUT about this question. I'm interested in what Justin is doing. However, I am certainly going to point out what I believe to be faulty methods and conclusions. The use of cross-state comparisons of SAT scores is a very risky business, placement of RI at #47 should not be taken at face value.
Not everyone starts with their conclusion and uses numbers to support it.
Sorry to quote myself, but
"The use of cross-state comparisons of SAT scores is a very risky business, placement of RI at #47 should not be taken at face value"
is far too weak a statement. I should have said:
"Given A) the recognized sample selection problem in the ETS data and B) the lack of any controls for other factors, NO reliable conclusions about the relative quality of the public education delivered in RI can be made from these data."
Mr. Schmeling,
Your desire for the perfect, errorless analysis is admirable.
However, as you well know, no matter what analysis is prepared, it can be manipulated and / or disputed.
Having said that, there is an old common sense saying: "If it looks like a duck, if walks like a duck and if it quacks like a duck, then it's most likely a duck."
What Justin and others are suggesting is that there appears to be a mountain of evidence that RI Public Schools are low performing at best.
More importantly, there does not appear to be any evidence proffered to suggest otherwise. Instead, we simply have folks (like yourself) that spend countless time and energy trying to justify, rationalize and explain the bad results …but never providing any compelling evidence to the contrary.
The bottom line is that:
1) SAT scores for RI are consistently lower than peer states, no matter how you slice & dice the data. Like it or not, SAT scores are a test & measure of basic education proficiency.
2) RI students are barely proficient in Math based on the most recent NECAP test results, which reported that only 22% of high-school juniors are proficient in math.
As a side note, it appears the NEA-RI knows this to be true and tries to use it to their advantage. NEA-RI Executive Director Bob Walsh’s assistant, Patrick “I too struggle with basic math” Crowley, wrote a broadly distributed “letter to the editor” late last year / early this year incorrectly claiming that the rate of Education spending growth had NOT kept pace with Inflation.
In fact, Education spending had grown at a rate 42% higher than Inflation. Mr. Walsh’s trusted, but math-challenged, assistant compared 5 years of Education spending growth to 7 years of Inflation.
We are still waiting for the NEA-RI to issue a correction. But me thinks they are counting on the public’s lack of math proficiency to notice their glaring error / misinformation campaign.
3) The best evidence of all, however, is that RI is amongst the highest in the nation when it comes to customers voting with their feet. That is, RI is amongst the highest in the nation in terms of people opting out of the Public School system and paying a premium to get away from it. No more Strikes, no more Work to Rule, no more Un-Accountability, no more enduring certain Tenured teachers that are nothing more than babysitters, etc.
Think of it like this: General Motors could make the best car in the world, but it doesn’t mean squat if they have no customers that want it. And that is what you are dealing with, more and more, with respect to RI Public education.
So the question becomes why?
I would suggest that there are two, although related, primary drivers.
And neither or them relate to a lack of funding, as RI has one of the most expensive public school systems in the nation and our Education spending has far outpaced the rate of Inflation (despite the NEA-RI’s best efforts to say otherwise).
Rather, the two key drivers behind the real (or perceived) poor performance are (1) the militant, unreasonable, entitlement-minded, “do it for the children” Teacher Unions, who every three years hold students and families hostage with their unrealistic demands and anti-free market tactics of strikes, work-to-rule, etc. and (2) the entitlement-minded mindset that suggests that a Free public education is a “Right” as opposed to a “Privilege”.
A free public education certainly should start out as a “right”, but at some point it becomes a “privilege”. For those gang-banging do nothing pieces of crap that have no interest in being part of a learning community, who detract and deter those that do want to learn, their “right” to a free education should cease to exist. We should, rather than wasting resources on them, kick them to the curb like yesterday’s trash.
But if we did that, the Unions would not be able to whine that they need an army of dues paying teachers to teach students.
If you want to improve the Public Schools and get people to return from the Private Schools, start calling a spade a spade. Stop making excuses for the Unions and the people that are not interested in learning. Stop wasting time trying to rationalize and explain away the overwhelming evidence of lousy Public Schools, and start going after the root causes …and that doesn’t mean going after more money.
Posted by: George Elbow at August 31, 2008 6:16 PMMr Elbow (but feel free to call me Tom or Thomas),
"Your desire for the perfect, errorless analysis is admirable."
I have no such desire, since it would be unreasonable. Careful, logical and responsible analysis is all I ask. Should I presume that you would ask for less? Any statement that "RI ranks 47th in SAT scores and therefore we can conclude X about RI public schools", is not responsible.
"However, as you well know, no matter what analysis is prepared, it can be manipulated and / or disputed."
People can cheat, lie, dissemble and be just plain bad at statistics. However, the fact that there is no perfect analysis does not mean there are not better and worse analyses. The willingness of some here to dismiss or ignore the selection problem in cross-state comparison's of SAT scores, because it contradicts what they "know" to be true, is, in fact, an irresponsible use of data.
"What Justin and others are suggesting is that there appears to be a mountain of evidence that RI Public Schools are low performing at best."
I do not have any basis for, or interest in, contradicting that statement. I'm prepared to accept that RI public schools are far from the best in the country, and MAY be substandard. However, I've seen NOTHING here on AR that is convincing by the standards I require for my own work. For instance, is there ONE piece of research produced or presented by the staff at the AR think-tank that employs controls for demographic variables? If there's been one, I haven't seen it. If there isn't one, then you're not doing the kind of analysis I would expect from a 'think tank'.
A willingness to accept incomplete, inconclusive, and downright irresponsible analyses makes it hard to take either conclusions the policy recommendations seriously.
1) SAT scores for RI are consistently lower than peer states, no matter how you slice & dice the data
Really? I'd like to know the basis for this statement. Have you done the analysis with the appropriate controls that would allow you to reach this conclusion? Has anyone? If not, you really have no basis for making this statement.
RI students are barely proficient in Math based on the most recent NECAP test results, which reported that only 22% of high-school juniors are proficient in math.
Have you done the analysis with the appropriate controls? Has anyone? If not, how can you know the meaning of this fact?
Frankly, I feel I'm being drawn into an essentially ideological discussion that I'm not very interested in having, and which I regard as irrelevant to the empirical question Justin raised, and which I consider to be interesting: "What do RI public and private school SAT scores tell us about A) the quality of education in RI relative to other states and B) what is the relative value of public and private education?
If you've got some data and anallysis on this point, I'd be glad to see it. If not, I hope you'll forgive me for not responding more fully but, as far as this particular thread is concerned, I'll be sticking to those issues from now on.
Posted by: Thomas Schmeling at August 31, 2008 8:07 PMTom,
So let me see if I've go this straight:
A set of identical twins who attended the same classes together, were raised in the same house and who take the same test (SAT, NECAP, you name it) achieve differnt results ...one scores high and one scores low.
What are we to do next? Not take the scores at face value? I guess we should do a bunch of pycho analysis and find out if the lower scoring sibling missed breakfast the morning of the test?
Guess what, the fact that little Johnny missed breakfast doesn't change the fact that he scored low on the academic achievment test.
Face it, RI consistently scores low on academic achievment Tests, be it SATs, NECAP, ACT, etc. ...despite all the money we've thrown at the problem. And you want to suggest that one can not draw any conclusions from the results. Give me a break, Tom.
With respect to the 22% Math proficiency per NECAP, you wrote: "Have you done the analysis with the appropriate controls? Has anyone? If not, how can you know the meaning of this fact?"
Quite frankly, I don't know the meaning of your comment. What controls are required? Students take a test. They are either proficient or they are not. Shall we do the Union redistribution thing and redistribute some right anwswers from those that are proficient to those that are not?
By the way, it did not go unnoticed that you conveniantly ignored the most telling evidence of lousy RI Public School Performance ...the high degree to which customers opt out of the system, paying a premium to get out of it. That really all you need to know.
Like everything that is wrong in RI (e.g. the Pension crisis), you can continue to "study the issue" or you can start acting based on the obvious.
Posted by: George Elbow at August 31, 2008 9:24 PMJustin,
The College Board allows students to take the SAT any number of times they want to until the student feels they have a good score.
The College Board also allows a student to erase all test scores before leaving the classroom or after leaving the classroom if the student feels they did not perform well.
A student taking the SAT is not penalized for skipping a test question. Only the questions that are answered are counted.
Starting in 2009 the College Board will allow students to withhold test sores they don’t want the colleges to see.
So when the College Board states: “not all students in a high school, school district, or state take the SAT Reasoning Test. Since the population of test-takers is self-selected, using aggregate SAT Reasoning Test scores to compare or evaluate teachers, schools, districts, states, or other educational units is not valid, and the College Board strongly discourages such uses.”
The above is a very valid statement and you can not cross compare states by using SAT scores.
College Board: “Understanding your score”
http://www.collegeboard.com/student/testing/sat/scores/understanding.html
Hiding score results Link:
http://www.usnews.com/articles/education/2008/06/24/kids-can-pick-which-sat-scores-a-college-sees.html
Ken,
Would you feel better and would it be more acceptable if we simply said the following:
"Those students that are educated in RI and choose to take the SAT, ostensibly because the have aspirations of attending college, typically demonstrate lower academic achievment as measured by the SAT scores when compared to other students who choose to take the SATs but are educated in states other than RI. These results are wholly consistent with the RI NECAP test results that demonstrate that only 22% of RI Juniors are proficient in math."
Of course, we could add a footnote that says: "Scores in HI can not be compared to other states because HI forces everyone to take the test, therefore their data is meaningless when comparing to other states, as it would be unfair to expect the student that does not plan to attend college to have been taught English, Math and Writing in the same manner and at the same proficiency level as those that hope to go to college."
By the way, Ken. With respect to your constant reference to the warning labels ...the US Federal gov't has speed limit signs all over the highways warning us not to drive over 55 / 65 miles per hour. But guess what, we ignore the warnings ...and we arrive safely, and FASTER.
Posted by: George Elbow at September 1, 2008 8:11 AMMr. Schmeling:
Presumably there is no perfect test or study, or benchmark, or yardstick.
But on the other hand, they cannot all be fatally flawed either.
Year after year, in study after study, in comparison after comparison, Rhode Island’s public schools come up short when measured against our neighboring states, and against U.S. averages (and in turn, year after year the U.S. averages come up short when compared to other advanced nations, such as in the OECD studies).
This uniformity of poor result on the part of Rhode Island’s public education system is certainly a valid indicator.
Indeed if the Rhode Island public education system’s performance was average or better, it would be an anomaly in Rhode Island government. Our state government has shown uniformly that it can’t do anything well and/or efficiently. In spite of some of the highest taxes in the country, the condition of our roads is embarrassingly bad; our bridges are literally collapsing, rated as being in the worst condition in the country; we have the highest per capita unfunded (public sector) pension liability in the country; we have a well-deserved national reputation for political corruption; our “economic development” is a sham, as we’re consistently rated one of the worst states in the country for business (i.e., employer) climate – for decades our young college graduates have had to leave the state in search of viable employment opportunities; and while our police and fire protection is pretty good, it comes at the expense of grossly inflated personnel counts.
In fact, one struggles to think of even one function that Rhode Island government does well, unless one thinks of welfare generosity / welfare magnet status as an “accomplishment.”
Accordingly, it is not up to us to justify our informed opinion (buttressed by the uniformity of published deficiencies) that Rhode Island’s public education system is poor, rather the burden is on the teachers unions and educrats to objectively and conclusively demonstrate that Rhode Island taxpayers previous and ongoing generous support via high taxation has been “well invested” and produced commensurate results – that they have been good and able stewards of our taxpayer dollars and young students - and so provide reasonable reassurance that future investments (much less increases in same) are likely to also prove “well invested.”
Years of studies and comparisons uniformly describing the substandard state of Rhode Island public education has only produced reflexive “shoot the messenger” and “discredit the study’s methodology” responses on the part of the teachers unions and educrats. So you’ll forgive us for concluding that they have nothing substantive or positive with which to rebut the cascade of studies, and so nothing substantive or positive to justify throwing more taxpayer dollars at them.
Posted by: Tom W at September 1, 2008 9:48 AMGee, I take a day to paint a children's room, and the academic derision comes out. Funny how attacks can escalate on a person who hasn't had a chance to participate in the discussion.
For the record, Thomas, I don't believe that any contributor to AR has referred to it as a "think tank." Indeed, in our discussions, moving toward being a think tank is among our stated goals. At some point, the Projo added the phrase to my bio line, and since RIFuture noticed it before I did and seemed to be so perturbed by it, I let it run that way for a while.
As for controls and so on, I don't claim to be a statistician. I'm just a carpenter — with limited time, after trying to support a family in this backwards state — who offers his thoughts on issues as they come up. I go as in-depth as time and interest allow, and I try to be as even-handed as possible when I do so. I also try to be as clear as possible about what I perceive the scope and import of my points to be.
As I did here, and in which context I responded to Ken. I did not "suggest that [state-by-state differences are] not a real, and serious, statistical problem." I was responding to a guy who, despite my strong qualifications explaining simply that I find something interesting in the data that conforms with a general hypothesis of mine, had no other response except to repeat what's already been said about the invalidity of broad state-to-state comparisons. Fine. Duly noted. Now, if that's his only point, others can proceed with the discussion without him.
I also didn't "suggest that ETS is only warning against cross-state comparisons in order to protect educational systems from accountability." (You seem to like pushing people to extremes — e.g., "only.") I do, however, think that the educational establishment's campaign against the SATs — which has been going on my entire adult life, which has decreased the test's prominence since I was in high school, and in which one often hears the company's defense that it warns against transstate comparisons — may play a role in the degree to which ETS hypes its warning. (Especially when the company apparently considers it valid for students to compare their own scores with the overall average.)
Indeed, of the four considerations that Ken lists (other than the one that spurred the above post and charts), two apply equally to all states, one is just a statement of grading methodology (again, applied equally), and one hasn't even happened yet. Truth be told, even if Rhode Island's only deficiency lay in not encouraging its students to take the test seriously enough to be roughly equivalent to students in other states who retake the test or otherwise attempt to improve their scores, then that might have some interesting implications.
Posted by: Justin Katz at September 1, 2008 10:11 AMJustin,
I did not mean to sound derisive, but I admit I was frustrated. Part of that frustration stemmed from multiple attempts to change the subject from the validity or meaning of the SAT comparisons to a general argument about the quality of RI schools, in which I was challenged to either accept that they are awful or prove that they are not. As I said, I have no interest in this. I do, however, have an interest in using valid measures and techniques to answer questions of "how much" and "why". If that turns out to show that RI is doing even worse than folks here suspect, so be it.
You say, "I did not 'suggest that [state-by-state differences are] not a real, and serious, statistical problem.'" Your actual statement was that it "doesn't phase me much", which struck me as a statement that you did not regard it as a serious problem. If that's incorrect, my apologies.
You say, " I also didn't "suggest that ETS is only warning against cross-state comparisons in order to protect educational systems from accountability." I should not have used the word "only", but apart from that I must have totally misunderstood the following sentence: "Inasmuch as the relevant educational systems have seemed resistant to any measurement by which they might be compared, it's little wonder that the company would discourage the tests' use for that purpose". That sounds like a clear statement that ETS is complicit in helping the education establishment to avoid accountability. If I misinterpreted, I apologize again.
However, given how those statements read to me, you can understand I found this frustrating too. If I may….If you came across me using a 2 by 4 where your expertise indicated that a much larger board was required, and warned me that my structure was unsound, and I responded with "that doesn't phase me much" or "fine, duly noted. If that's your only point, the construction can continue without you"), and if I went further and suggested your concerns were part of a conspiracy with the lumber yard to sell more wood, I expect you would probably become at least a little impatient with me.
All that aside, your effort to restrict the analysis by participation rate might help, but it's hard to tell from the graphs. As I offered in an email to you yesterday, if you want to email me the data set, I'd be glad to run the regressions and see what, if anything, it yields. (I suspect someone will warn you against doing this out of concern I will "juke the stats". Beyond my personal assurance that I have no motive doing anything but the most honest analysis I can provide, I'll note such an effort would be easily detectable and (given that I do some of this stuff for a living) would amount to professional malpractice or worse. In addition, I'll be happy to promise to email you the results privately and let you decide whether you want to post them here or not).
Finally, comparing an individual's score to the rest of the scores or the overall average isn't a problem,. "Johnny did better than 95% of the other test-takers" is a perfectly valid statement. You can even validly say "the average score of RI test-takers was below the average scores of test takers in 46 states". So there is no contradiction in ETS simultaneously encouraging across-student comparisons and discouraging the comparison of aggregate scores across-state The sample selection problem arises when one tries to use the data either A) to make statements about the population from which the sample was drawn (all RI students as opposed to RI test-takers) or B) to explain the results as an effect of some factor, such as the quality of the education systems of the states.
No, my actual statement was that the fact of self-selection doesn't phase me much. You're broadening that to include the existence of statistical problems. As discrete considerations each problem may be addressed and incorporated into analysis.
As for ETS's complicity, I've already explained my view. I don't believe that the company is saying anything false with the direct intention of "helping the education establishment to avoid accountability." I believe that it's got a manifest incentive to emphasize the wiggle room, if you will.
All of this goes to the disparities of your construction comparison. In our current discussion, I'm attempting to figure out a complicated roofing system that doesn't seem to work quite right, and I'm holding up a 2x4 that should fit within tolerance and have explicitly stated that adjustments would have to be made (e.g., switching to a 2x12) before the structure is put together. And along comes Ken insisting that a 2x4 just won't work as a rafter. Yeah, fine, we know, noted.
Posted by: Justin Katz at September 1, 2008 7:31 PMTom,
Based on your above comments, would you at least agree that for those who chose to take the test, RI test takers rank near the bottom?
Then, would you agree that those taking the test (certainly in RI) are typically the students that aspire to go to college and therefore would be expected to be the students most capable of achieving high scores? Said differently, those that don't aspire to go to college and would likely not score well on the SAT don't typically take the test. If they did, the scores would be lower.
Thus, with the above two in mind, would you not agree that RI Public schools, based on SAT scores, are relatively poor performing?
Would you also not agree that such a conclusion is consistent with the NECAP scores, which put RI Math proficiency at a mere 22% for juniors?
And would you not further agree that such a conclusion is also consistent with the fact that a large portion of the Public School customers have opted out of the system, despite having to pay a premium. Clearly the ultimate customers who are opting out are capable of determining performance without using Minitab?
I think we can safely say that for those students for which academic rigor is important, RI public schools are failing them.
We should spend less time trying to disprove what is glaringly obvious and get on with the solutions.
It may not be as politically safe as noodling thru reams of statistics and endlessly debating their meaning, but at some point you have to accept reality and start asking the Teachers' Union why they think more money is going to change the results.
Maybe it is time to tell the Unions that we tried doing it their way and it ain't working, so we are going to try something different, starting with passing Right To Work legislation and firing the next group of Union hack teachers that go on Strike for even a minute.
Will it improve school performance? Well, we won't know unless we try. But as noted, we've tried the Union way and it ain't working ...no matter how much regression analysis you do.
It's real simple. We can do what RI does best, which is to twiddle our thumbs "studying the issue" while Rome burns, or we can make some educated guesses (with the risk of being partially wrong) and get on with solving the problem.
What's it gonna be Tom? Should we wait for 3 more years of data ...to tell us what we already know?
Posted by: George Elbow at September 1, 2008 9:10 PMJustin,
"No, my actual statement was that the fact of self-selection doesn't phase me much. You're broadening that to include the existence of statistical problems."
The self-selection problem IS a statistical problem.
"And along comes Ken insisting that a 2x4 just won't work as a rafter. Yeah, fine, we know, noted."
Are you saying that you already knew, before Ken came along and before you posted the 50 state comparison of SAT scores, that it's not appropriate to make across-state comparisons of aggregate SAT scores? If so, I'm flummoxed.
Is there any chance you'll be sending me the data?
Justin.
A 2X4 could work as a rafter in place of a 2X12 but it depends on the span, load per sq ft and building code you are working to.
Now, you're just playing games. I've already given some reasons why a particular statistical problem isn't a conversation-ender for me. You're behaving as if I'm arguing for ignoring statistical problems when in fact this entire post addresses one such.
And you're jumbling chronology.
1. I posted on RI's comparison with national and neighboring-states results as well as RI public v. private.
2. Just because I'd taken a moment of curiosity to collect the national data, I posted it, stressing that it was for the curious. At that point, several folks on and off line pointed out to me why the particular states at the top of the list were likely there.
3. Seeing clearly that the participation rate was an important factor, I roughly controlled for that and threw in some other factors to see what might shake out. As I did so, I noted several times that I wasn't making broad claims of high confidence based on the results.
4. At that point, Ken mentioned the disclaimer.
"Before Ken came along" and "before you posted the 50 state comparison" are two different points along the time line.
I've intended to send you my Excel file, but I want to take a look at it first, and I'm very busy. If you've got anything to say on it, I'll be happy to publish your comments as an Engaged Citizen post, if you like. As for the above conversation, I've had enough ridiculous bickering. Rephrase this comment however you wish, and I'll let it go at that...
Posted by: Justin Katz at September 1, 2008 10:32 PMJustin says, As for the above conversation, I've had enough ridiculous bickering. Rephrase this comment however you wish, and I'll let it go at that...
I'll bite my tongue on any further comment. Send me the data when you have a chance and I'll do what I can with it. Take your time...I'm about to get way busy myself.
best,
Tom
Tom,
I hope you get as "way busy" with solutions as you do with endless study & analysis of the obvious.
Posted by: George Elbow at September 2, 2008 7:31 AMStill here, George?
George says, "I hope you get as "way busy" with solutions as you do with endless study & analysis of the obvious."
In fact, George, I've been somewhat busy along these lines for some time. Perhaps not all the activities are ones that would satisfy your standards, but I'm rather proud of them. You might be interested in one example: I testified at the statehouse twice last spring in support of bills that I thought would be beneficial. You might find it interesting to know that both were opposed by the NEARI, AFT and PTU. I don't regard that as a measure of their value, but you might.
If you've done more than I, I commend you. But I promise you that your attempts to goad me into action are unnecessary.
As to "endless study and analysis of the obvious", I just think that if one is going to present statistics, one should be as careful as possible with claims about what they mean. It's an occupational hazard, I guess. I try to bear in mind the quote, attributed to Twain, that "It ain't what you don't know that gets you into trouble. It's what you know for sure that just ain't so."
Posted by: Thomas Schmeling at September 5, 2008 3:13 PM