
February 10, 2008

Which Way the Population Blows
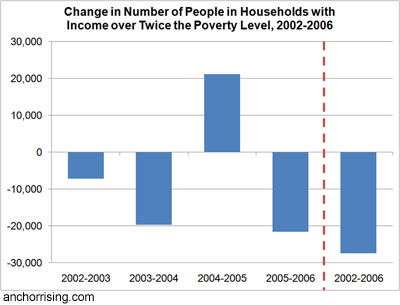
With the numbers debate becoming increasingly involved, and now that it is clear that we RI bloggers are no longer merely talking among ourselves, I thought to expand my examination of population and wealth trends in Rhode Island. The most straightforward method is to start where I began with my proclamations of middle-to-upper-class flight from the state:

As I've explained before, this chart shows that, from 2005 to 2006, Rhode Island lost about 30,000 people whose households had been over three times the poverty level (roughly $60,000 for a family of four), and almost 22,000 over twice poverty. As a matter of personal history, I made limited use of this information until, at the tail end of December, WPRO's Matt Allen spurred me to look again, at which point I was actually surprised at how high the number had been.
Of particular concern, as I began to broaden my inquiry, was the observation that, stepping back a year, from 2004 to 2005, the number over five times poverty actually grew 22,058, over three times poverty 21,754, and over two times poverty 21,166. In other words, 2005 saw a spike at the high end, and although the 2004–2006 results still show losses of 2,498 (5x), 6,495 (3x), and 471 (2x), I have to admit that I had begun charging as if I carried a sharper sword than I actually held.
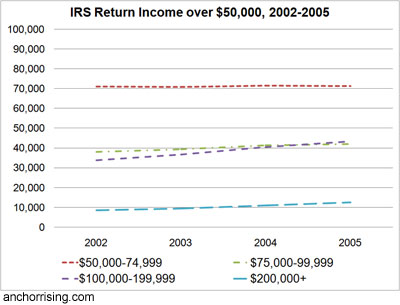
Unfortunately, 2004 was the first year for which the Census broke out the income to poverty ratio with such a degree of granularity. However, the income to poverty ratio is provided up to twice poverty beginning in 2002, with the following results:
Whether it has something to do with the measurement of the statistics or actual events in the state, I haven't been able to determine. It is clear, though, that the spike in 2005 was more the oddity than the plunge in 2006. Trying to explain the data, I turned to U.S. Census household income data.
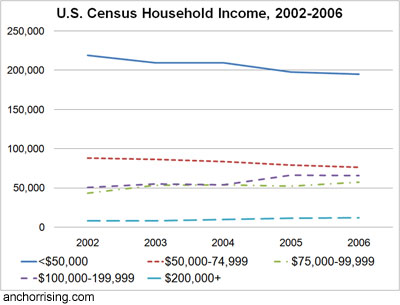
As is plain, the spike was specifically among households earning between $100,000 and $199,999 in the twelve months before the 2005 survey. For a view that highlights the range on which we've been focusing thus far, the following chart zooms in on households with incomes over $50,000.
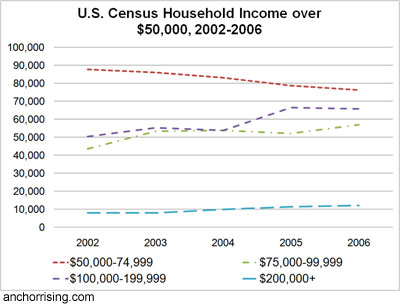
By the numbers, households with incomes over $75,000 per year (which one can very roughly compare with three times poverty) increased 12,364 from 2004 to 2005 and 5,032 from 2005 to 2006. Households with incomes over $100,000 per year (which one can somewhat more accurately compare with five times poverty) increased 14,092 from 2004 to 2005 and 23 from 2005 to 2006. Although both groups advanced more slowly in 2006 than 2005, all of the numbers are still positive.
However, factoring in household size helps align this data with the income to poverty ratio data above: From 2004 to 2005, married households earning over $100,000 per year increased 11,048, but from 2005 to 2006, they decreased 815. All of that decrease came from married with kids households, which only increased 6,007 in 2005 and which decreased 1,033 in 2006. What I'm getting at is that the decrease on the household income chart came in large part from families, whereas the income to poverty ratio data is individuals whose households have that much income. That doesn't explain all of the difference, but it does describe one ripple in the wave.
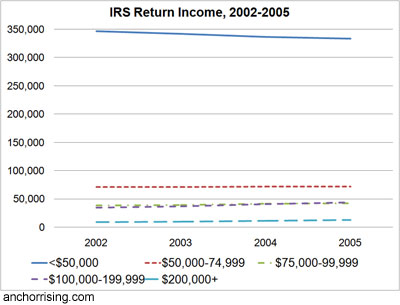
Because the clincher of this post (as long in coming as it's already been) comes via IRS data, let me offer the related figures from that data set. Perhaps the most significant finding is the support that the comparison lends to the hypothesis that families are partly (maybe mostly) responsible for erraticism of the income and income to poverty ratio trends. Lower income households are less numerous than lower income returns, while the opposite is true at higher incomes, which would happen if couples filed separately or households had a third income earner.
Don't forget, when comparing these to the Census charts, that the IRS has not yet released data for 2006, so the downturn is not present in the data.
And now, without further delay, here — purchased with a small percentage of readers' generous donations over the past couple of weeks — is the data that ought to simply end the conversation about what's happening and propel the conversation about what we ought to do about it.
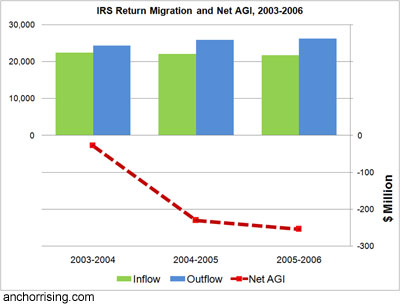
Lest disbelief lead you to doubt your reading ability, the chart does indeed show net losses in tax returns of 1,818 from 2003 to 2004, 3,869 from 2004 to 2005, and 4,427 from 2005 to 2006. The corresponding loss in citizens' adjusted gross income over that total period was indeed $513,117,000, and to the surprise of nobody who's read the above, 2005 marked a huge increase in that amount.
One might surmise, although my research hasn't gotten far enough to state it as more than a theory, that the leap in "wealthy" citizens in 2005 was the result of houses sold in the course of leaving the state. The migration data is attributed to the year in which the return was filed (i.e., the year after the income in question), while the Census data is income over the previous twelve months for a survey that took place throughout the year, so both would be in keeping with a large burst of income at some point during 2004 and 2005 and tax returns filed in 2005 and 2006.
As one final piece of the puzzle (for now), I compared the average AGIs of those coming to the state from and leaving it for the five counties in Massachusetts and Connecticut that are right across the border. These populations, it seems to me, are the most likely to include migrants who either work in or have close ties to the areas that they are leaving. They might include, among other groups, low-income families pursuing Rhode Island's extended benefits (incoming) and workers who just can't take the taxes and poor infrastructure of their home state (outgoing).
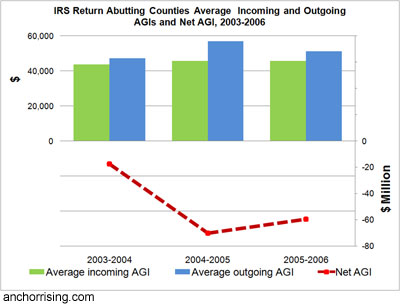
I suppose the shadow of doubt is in the eye of the beholder, but it would take quite a bit of argument to persuade me that middle-class and above citizens of Rhode Island — especially families — are not loudly declaring — by placing their families beyond the tax collector's reach — that they will not accept the likely solutions of the General Assembly to our financial crisis.
Now what do we do about it?
ADDENDUM:
One factor on the table that I didn't address above is the Phoenix Marketing data that has Rhode Island climbing from the 20th highest percentage of millionaires to the 17th. Thus far, I've mostly pointed out that our neighbors, Connecticut and Massachusetts, are consistently in the top 5, and some have suggested that we can't make that comparison. However, upon closer inspection, it turns out that Rhode Island's "improvement" was largely due to the number of non-millionaire households that have left. (We also have a discouraging foretaste of the likely results of Census and IRS data collection for 2006 and 2007.)
| 2006 | 2007 | Change | |
|---|---|---|---|
| Total households | 428,941 | 424,216 | -4,725 |
| Millionaire households | 20,229 | 22,550 | +2,321 |
| Millionaire % of total | 4.72% | 5.32% | +0.6% |
| Rank | 20 | 17 | +3 |
If Rhode Island had not lost 1.1% of its households from 2006 to 2007 — that is, if its household population had remained the same — then millionaire households would have accounted for 5.26% of the total, which would have put us right back in slot #20, just keeping pace with national trends, perhaps because of some of the very policies that the progressives and the Democrats are heaving onto the chopping block.
Holy mackarel, Justin. Awesome post.
Posted by: Monique at February 10, 2008 12:21 PMwhy don't ypu interview a few estate planning attorneys. they are all advising people to get out of ri.
and these are the peopel that pay the most taxes
The solution:
Eliminate the income tax.
Eliminate the car tax.
Cut capital gains tax in half.
Eliminate the Estate tax.
Reduce the sales tax to 4%.
Cap property taxes at 1%.
Re-open all contracts. (When the cry babies screem, ignore them.).
Make pay, health and retirement benefits competitive with the private sector. (When the cry babies scream, ignore them).
Announce to the free-riders that the party's over. (When the cry babies screem, ignore them.)
Count the money. Re-budget to fit a revenue plan commensurate with the above tax plan. Provide services that serve the interests of all Rhode Islanders (security, safety, infrastructure).
Close the casinos.
Sell all the excess office space.
Watch all the losers move to a "blue-er" state.
Watch productive people and businesses flock to Rhode Island.
See Revenues grow.
Further reduce taxes.
YES! I'm dreaming... Let me dream!
Dreams can come true ... in New Hampshire!
As for Rhode Island, well, it's more like a coma.
Posted by: Tom W at February 11, 2008 11:05 PMYour desire to put the conclusion first has distorted the way you look at your data.
Maybe people move to Attleboro to shorten the commute to Boston. They leave the state, but not to avoid taxes.
There is no necessary link to taxation in anything you've presented. It would take a lot to convince you because you refuse to consider other possibilities. I'm not saying my suggestion is RIGHT, but my reason is just as plausible as yours. And you have no more proof than I do.
And, I suspect, there are probably as many reasons for people moving to Mass as there are people moving to Mass.
If the wealthy sold their house and moved out of state, then they wouldn't be filing RI income tax for the portion of time after they left. So they wouldn't show up as wealthy.
Plus, selling a house is not a taxable event so long as you purchase another w/in 6 months. Thus, the proceeds of the sale would not be reported on the 1040.
These two facts rather seriously damage your explanation about why all the extra folks show up in 2005.
It appears that family size is the latest canard used to distract. Poverty rates are adjusted to account for the different number of persons in the household. "A Family Of Four" is a relative measure, not an absolute one. As such, it is irrelevant to considerations of where one stands vs the poverty level. Census data is usually given in both households and families exactly for the reason of making apples-to-apples comparisons more easily.
RI Census data show that, overall, were approx 70% more households/families over the $200k threshhold in 2005 than in 2001. Any single year dip does not alter the trend.
Moreover, this growth at the top end is part of a national phenomenon. For the last 30 years, the top end of the scale (in particular the top 1%) has seen its wealth grow tremendously. To the point that Forbes Mag had an article on how the "merely" wealthy--like Fortune 500 CEOs--are being left in the dust by the ultra-wealthy, such as hedge fund managers. Which leads to the next point.
No amount of wishing it weren't so changes the fact that how a state performs economically is a function of what sectors predominate in that state, and which sectors are doing well in a given time period. In the 60s, states that made cars did well. In this decade, states with strong financial sectors did well. In the next 10 years, it will be something else. There is a calculation, called "Thiels T" equation that calculates the differences in income sectors.
And, if taxes cause people to flee a state, why do six of the states with the lowest tax burdens fall into the bottom 15 for median income? That is, 60% of the states with the lowest taxes also have 6 of the 15 lowest median incomes, and the 7th tops is still in the bottom half.
So 70% of the states with the lowest taxes are in the bottom half of the median income ranks. Why aren't all the rich people moving there?
And CT has the 8th highest tax burden in the country. Why aren't the rich people all moving out of CT?
Also, the size of RI is a significant factor. In your comparisons between RI and MA/CT, you assume simple arithmetic progressions and linear relationships. That oversimplifies to the point of serious distortion. When a certain critical mass is reached, the progression in wealth creation is geometric, and not arithmetic. As such, your attempts to compare one-on-one, based solely on tax issues, is like trying to hit a baseball with a golf tee.
As for your "piece de resistance," I must admit being baffled by what you believe this proves. That AGI decreased in a given year? How can the incidence of (perhaps?) two years be set out as conclusive of anything?
(Truly, though, the paragraph under the chart showing the decrease in AGI borders on gibberish. I've read it half-a-dozen times, and still can't quite make out what the point is. A huge increase in what amount? AGI? Then the two-year drop was an abberration.)
Actually, it can be used as you intend, if you have already decided what your conclusion is.
Please, I sincerely admire your pursuit of information. However, you need to grasp more about economics than whatever it is that gets bandied about on these sites as "Econ 101." If Econ 101 was the be-all and end-all, there wouldn't be an Econ 201. You need to realize that these sorts of investigations are probably beyond your math skills.
No serious economist would venture to say she could prove what you're trying to prove, because the data are not straightforward, and are liable to differing interpretations. However, your supporting arguments are particulary feeble.
I am not an economist, nor do I purport to have anything like a definitive answer. However, I know enough to realize how much I don't know. I suspect you cannot--or is it will not?--make the same claim.
In short, you have not presented anything that truly substantiates the claims you make. Rather, you have decided that high taxes are the problem of all RI's woes, and interpret your data accordingly. As such, your method "has become unsound," (to put in terms perhaps more familiar to you) and is, therefore, not at all convincing.
Keep trying, though. Facts have a liberal bias, and you'll bang into that sooner or later.
Posted by: John Huss at February 12, 2008 9:31 PMKlaus (John Huss... why not use your real name, Mr. M? Because it would link you to your wife's financial interest in the status quo?).
Your comments mean a lot coming from the guy who said that RI's jump in millionaire rank was "HUGE." Well, maybe it was, but for different reasons.
Per your history on this site, you seem not to have understood the arguments that I've actually been making, or the claims that I draw from them. Also per your history, you probably won't come back to this comment thread for further discussion, so I'll keep my response brief.
At no point have I made the claim that high taxes, of themselves, are driving people out of the state. The closest I've come is to say that Rhode Island is in trouble, and it seems to me that many people aren't optimistic about our government's ability to get the problem (or themselves) under control. I'm merely pointing to trends that I've observed and suggesting that increasing taxes in any way strikes me as likely to exacerbate the problem.
And unfortunately, with the huge decrease in taxpayer income (via emigration) for the two latest years for which we've data, I don't think we've time to sit around and assume an aberration. In other words, sitting back and trying to discredit me doesn't suffice; you need to show me why what I'm describing (not what you think I think the causes are) is incorrect or explain why my suggestions for the future are misguided even if my assessment were on the mark.
Regarding house sales as part of one's income tax return, I'm not an accountant, nor have I sold many (any) houses, but there's a difference between AGI and taxable income. It's likely that the capital gains considerations are part of the reason that in (e.g.,) 2004, the aggregate AGI of Rhode Islanders earning between $100,000 and $200,000 was over a billion dollars more than the aggregate taxable income.
My income charts do indeed show a gradual increase among the very wealthy. My argument is that those in the $100-200K segment bumped up because those who make less made more those years, based on one-time income.
You've also misunderstood the IRS data: these are returns traced by social security number, so a family moving to another state would still appear among the data, and the IRS knows their migration patterns, because it links them with the prior year's return.
Your struggle to dispute what I'm saying is palpable. Look, I leave open the distinct possibility that newer data will prove me wrong, and I'm very interested to see it. But again, how many years of data — that is, how many years of financial slippage — would you have us endure before we fix the structural problems that are, in one way or another, helping to push us down?
Posted by: Justin Katz at February 12, 2008 10:42 PMThis is why I come under different names. The idea is to listen to what I say, not debate who I am. My identity doesn't matter. What I say does.
I started the different name thing for a reason. I was treated as a troll, rather than as a serious commentor, so I decided to act like one. Well, that got old.
I stopped coming because spending time here got to be like spending time with people I don't especially like.
A couple of things: per your history, when I point something out, you deny that you ever said that. Well, you did it again. If taxes aren't your issue, then what is? Why are people leaving?
Here's something to think about: if it's the working people ($50-$75k) that are leaving, and if the adjacent counties in MA are growing, then maybe my suggestion is correct: they're leaving to work in Boston. That gives me two me pieces of evidence to support my contention, and leaves you with pure speculation.
No, the number of people over $200k is a number, not a percentage.
And, again, if it's the tax issue, why wouldn't the top-tier people leave? Why is the working class? Because they're getting jobs elsewhere.
And you say you're not an accountant. That's my point. I'm not an economist, but I know enough about it to realize that no legitimate economist can prove what you're trying to prove. Otherwise, this would be a settled point. So, if they can't, you're simply blowing smoke. You are in so far over your head on this that you don't even realize you're in a hole. If you want to see what econ arguments sound like, go see what happens on Economist's View.
OK, Justin, I'm out of here. When I heard you were putting up graphs I had to check it out. But, nothing's changed, so I won't be back.
Toodles.
Posted by: klaus at February 13, 2008 6:12 AMKlaus,
Who you are is relevant because experience with you gives busy people a sense of the value of debate. Two years ago, I'd have attempted discussion with you; one year ago, I'd have responded point-by-point for other readers' benefit. Since then, I've decided that you don't merit that sort of claim on my time. You rhetorical style is unmistakable, and I've no intention of marching through your arrogant insults as you layer on points of varying relevance with the presumption that I'm obligated to figure out what exactly your point is and research uncited statistics only to have you pile more on.
Take the above: You're behaving as if my claim is that every person who's left RI did so consciously to avoid our taxes, and any speculative evidence to the contrary addresses hours of research and consideration. Then you throw up an incomprehensible smokescreen about national comparisons when, in "John Huss's" last appearance, you disputed the notion that Rhode Island's economy could even be compared with those of our neighbors.
Your argument seems to boil down to a refutation of the notion that we can possibly understand trneds sufficiently to guide our policies, leaving us no choice but to continue to finance nation-leading benefit & give-away regimes.
Sorry. Don't have the time for that.
Posted by: Justin Katz at February 13, 2008 7:43 AM